Play
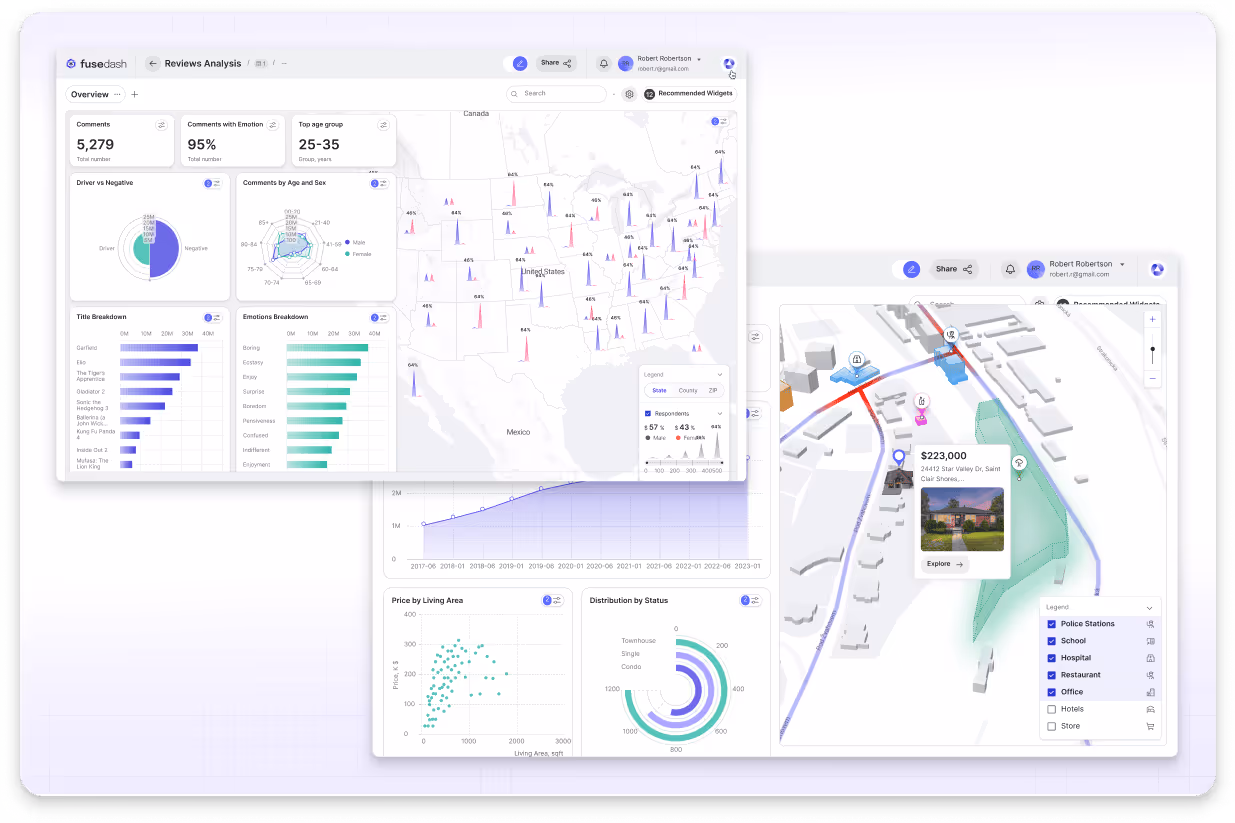
Fusedash is an AI data visualization platform built for teams that need clarity fast. Create dashboards, charts, maps, and storytelling reports in one workspace, then use data chat to explore what changed without digging through endless tabs.
.png)
Founded by a team of data enthusiasts and UX specialists, Fusedash was created to address a common problem-making data accessible, engaging, and actionable for everyone. Today, we serve businesses worldwide, revolutionizing how they interact with their data.


Our purpose is to help teams make better decisions with less reporting friction. We’re building a data visualization platform that stays easy to use while growing into complex workflows.

Fusedash brings the most important reporting workflows into one workspace, so teams can build, explore, and share insights without switching tools.


Our platform is flexible across industries, but these are common starting points where dashboards and monitoring have immediate impact.
Fusedash is built as one workspace for the full analytics workflow: build a view, investigate what changed, and share a clear story. These features are the building blocks, but the value is how they work together.

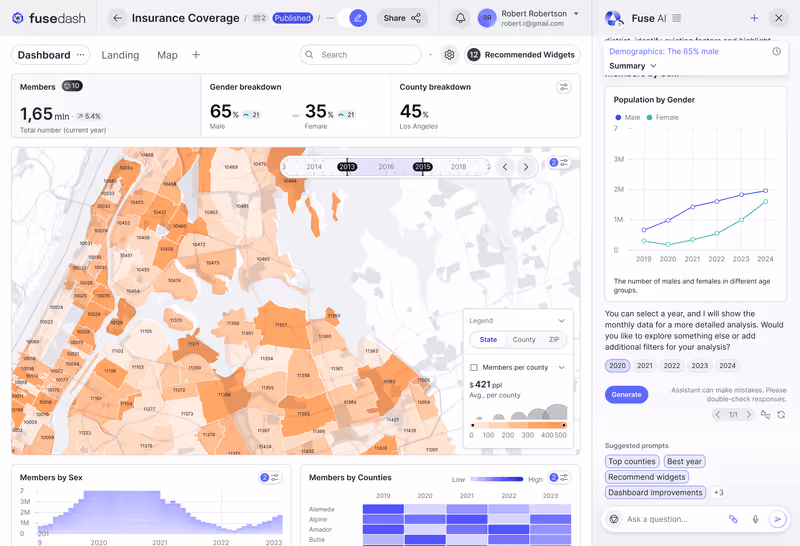
Dashboards are where teams align. We built Fusedash dashboards to stay clean at the top level, then go deeper with filters and drill-downs when something moves.
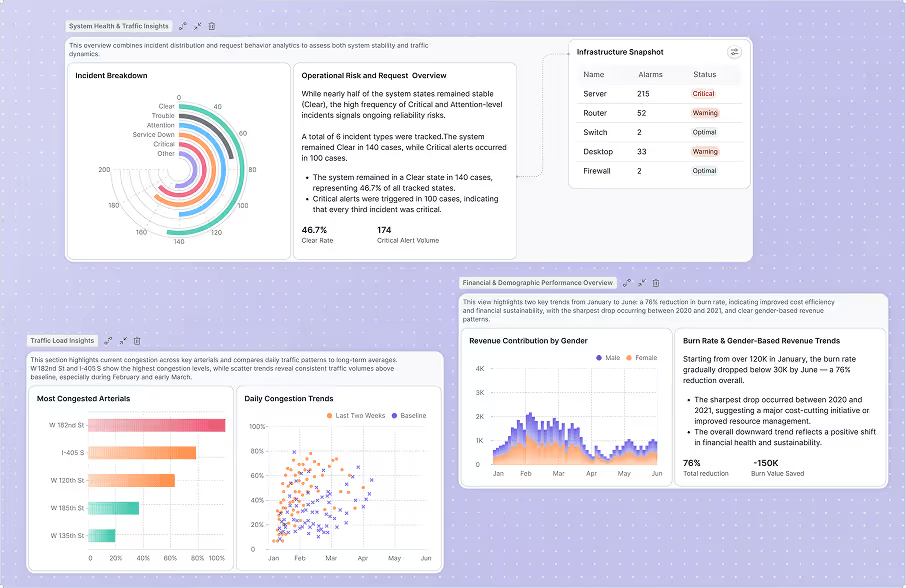
Insights get lost when they are scattered across charts. Storytelling keeps context: what changed, why it changed, and what happens next, in a format leaders can follow.
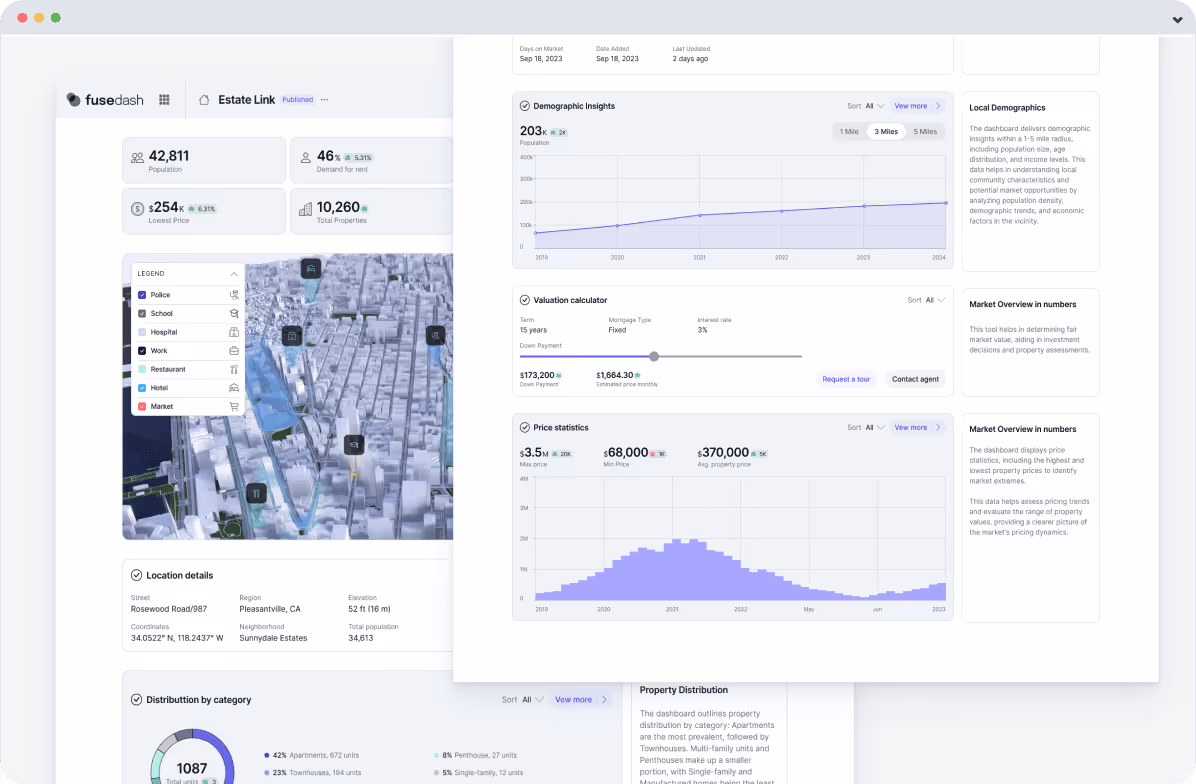
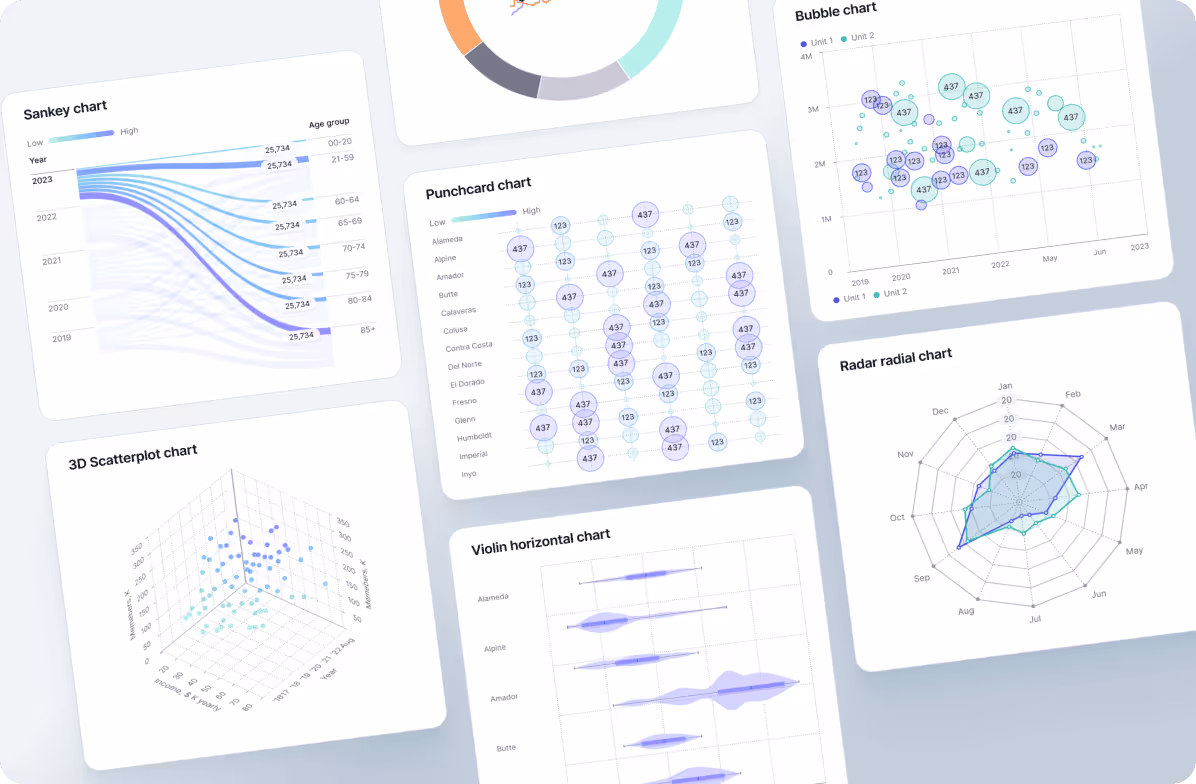
Charts should make comparisons obvious. We built chart creation around clarity: trends, breakdowns, and period comparisons that help teams explain movement confidently.
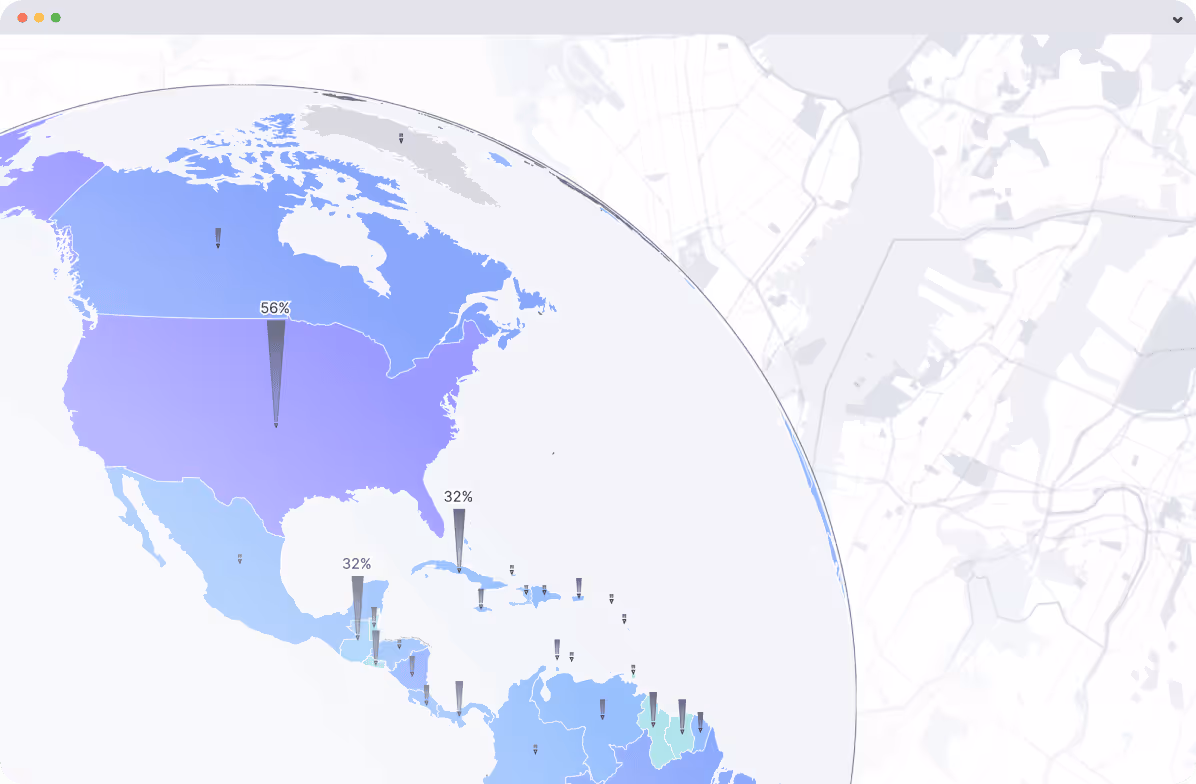
Location is often the missing context. Map views help teams see regional patterns and outliers that tables hide, especially across sales, ops, and market performance.
When a KPI changes, the next question is always “why.” Chat helps you explore the next best breakdown and get to an explanation faster without clicking through menus.
Some metrics are too expensive to review later. Real-time views help teams monitor live performance and respond while impact is still recoverable.
From product updates to industry breakthroughs, our blog keeps you informed and inspired. Stay connected and elevate your data game with Fusedash!
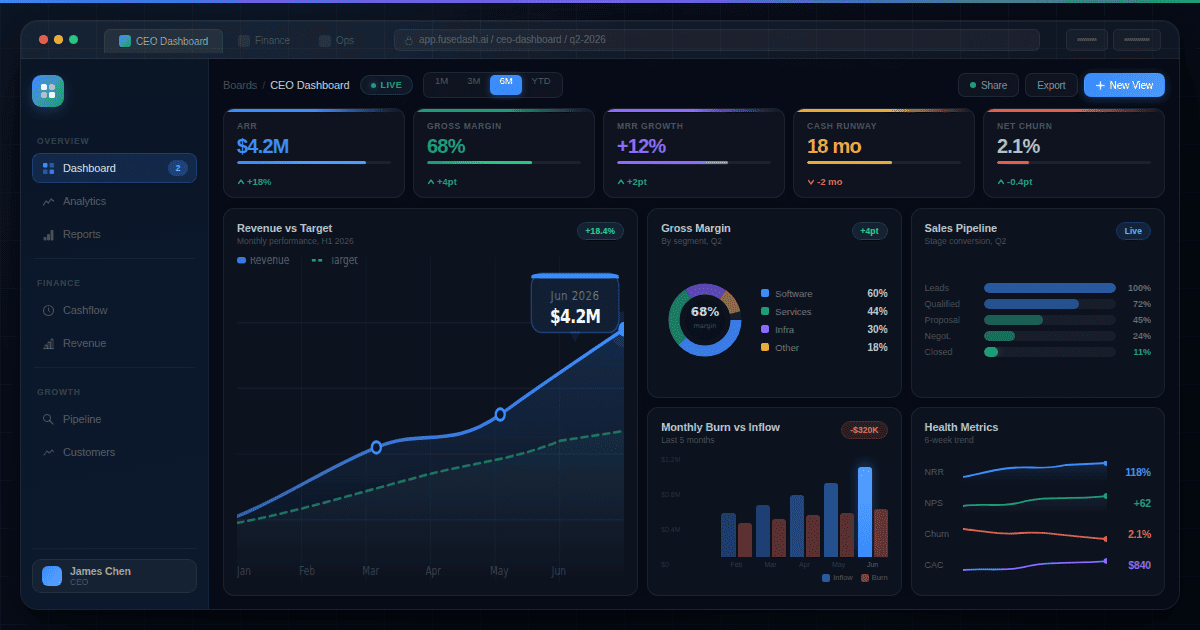
What belongs on a CEO dashboard changes by stage. A founder needs five metrics; a scale-up CEO needs ten different ones. This guide covers what to track at each stage, the metrics that look CEO-worthy but quietly waste leadership time, and a weekly cadence that turns the dashboard into an operating system.
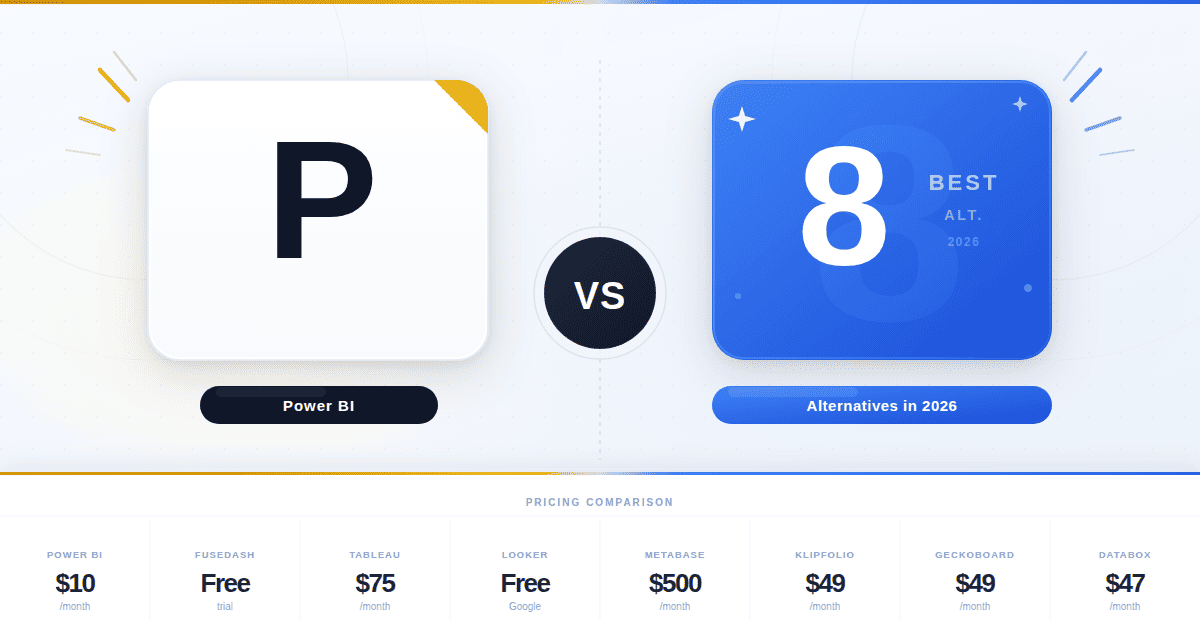
Microsoft's April 2025 Power BI price increase made "leave Power BI" a quarterly board agenda item. We compare the 8 alternatives that data leaders are actually shortlisting in 2026 with verified pricing, honest tradeoffs by buyer archetype, and a migration playbook covering DAX translation across platforms.

7 Klipfolio alternatives compared by pricing, white-label cost, and AI capabilities. Honest editorial review of AgencyAnalytics, Whatagraph, DashThis, Fusedash, Databox, Looker Studio, and Geckoboard for agencies and SMB teams looking for a better fit.
Start a free trial or request a demo to see Fusedash in action.
Quick answers about demos, onboarding, integrations, and security.
Fusedash is an AI data visualization platform for dashboards, charts, maps, storytelling reports, and data chat in one workspace.
Teams that rely on recurring KPI reviews and need a consistent way to explore changes and share insights across stakeholders.
If you can export a CSV, you can start immediately. If you have APIs or a database, tell us which systems you use and we’ll confirm the best connection path.
Yes. We can help standardize KPI definitions and build a reporting layout that stays consistent across teams and time periods.
Fusedash is built around decision-ready views and faster investigation, combining interactive dashboards with AI-assisted exploration and storytelling.
Yes. Real-time monitoring is useful when KPIs can shift quickly and delays are expensive.
You can explore examples and templates on our dashboard examples page.