CFO Dashboard for Finance Teams Covering Budget vs Actual, Cash Flow and Close Reporting

The financial services dashboard built for banking and fintech teams who need to see what changed, not just what the numbers are.

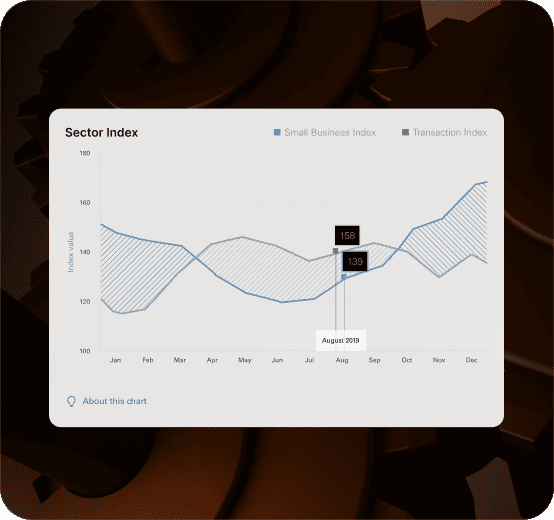
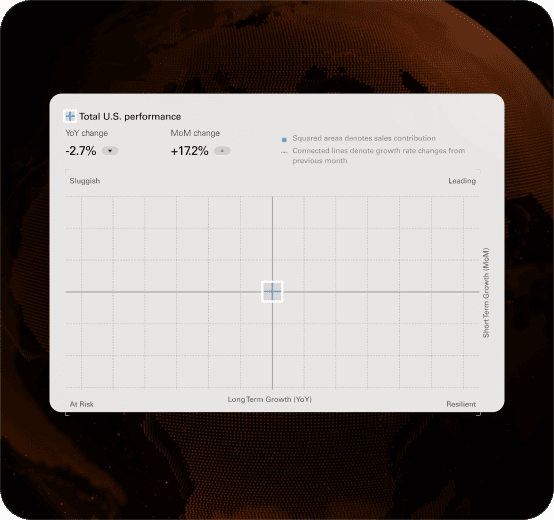
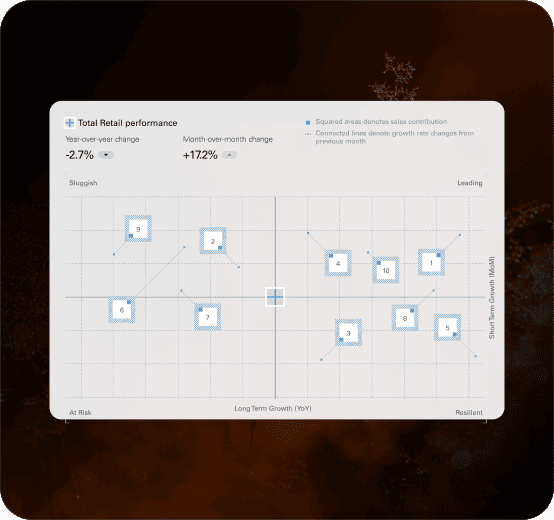
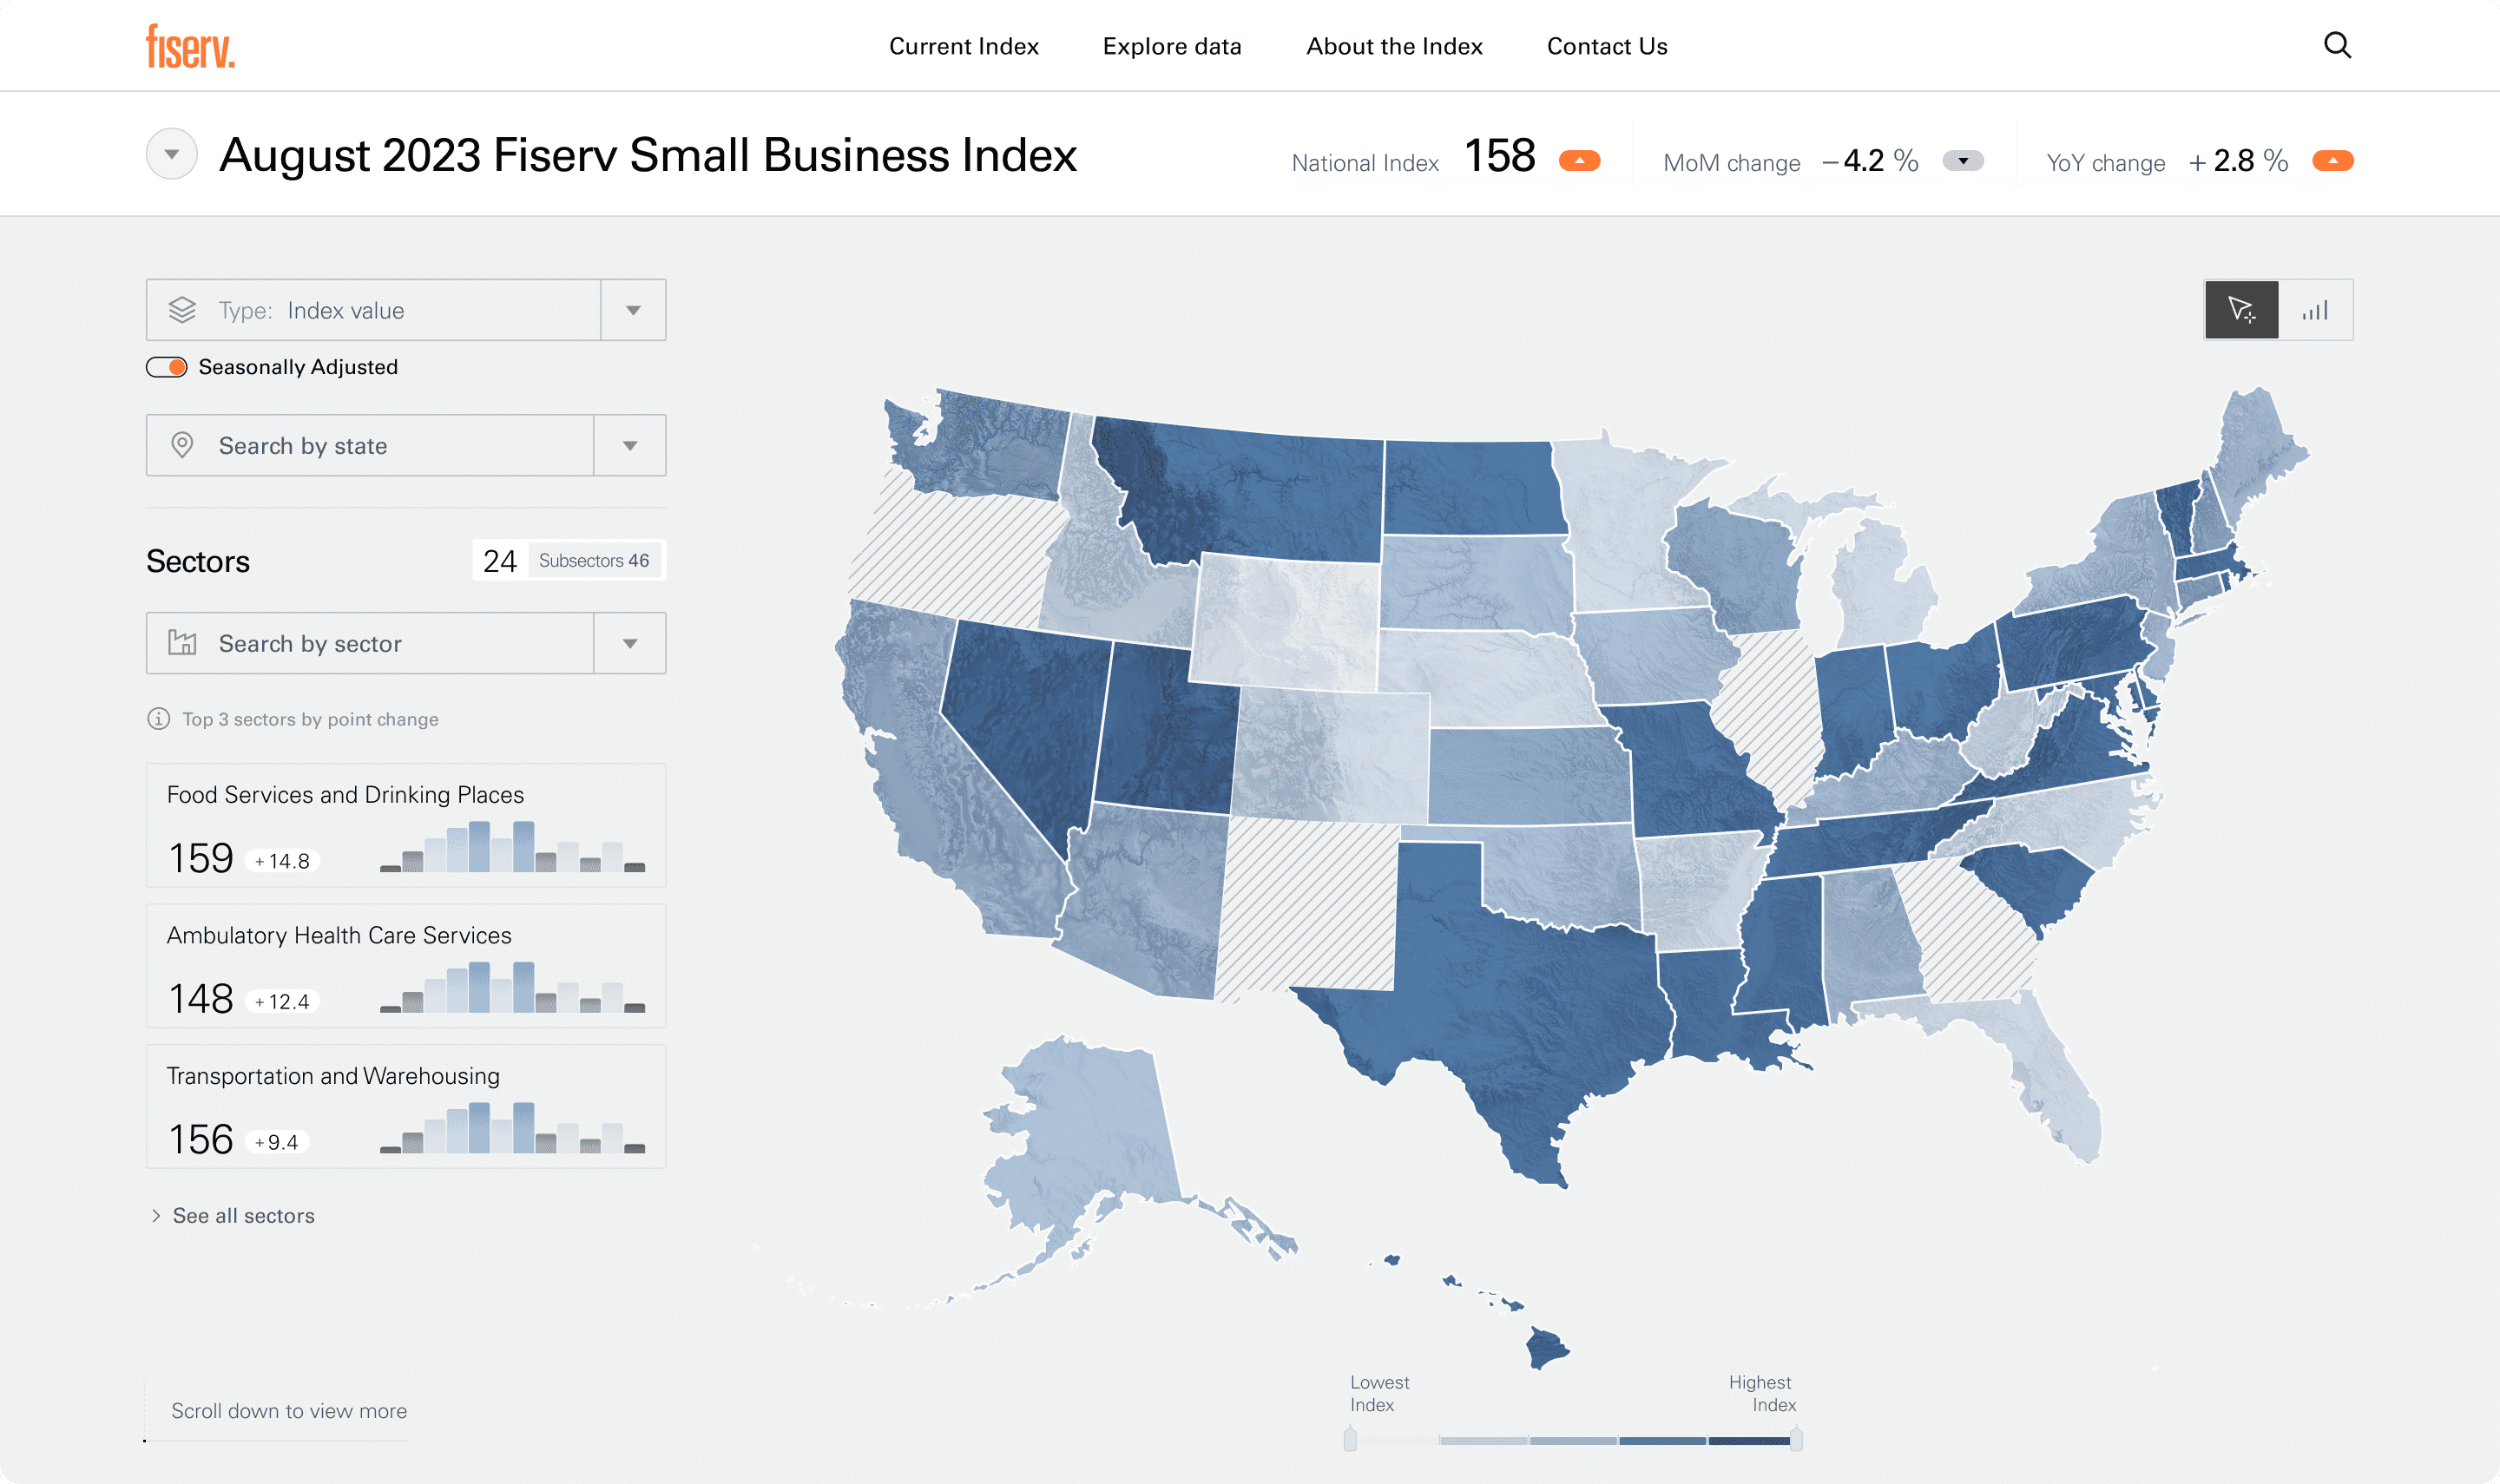
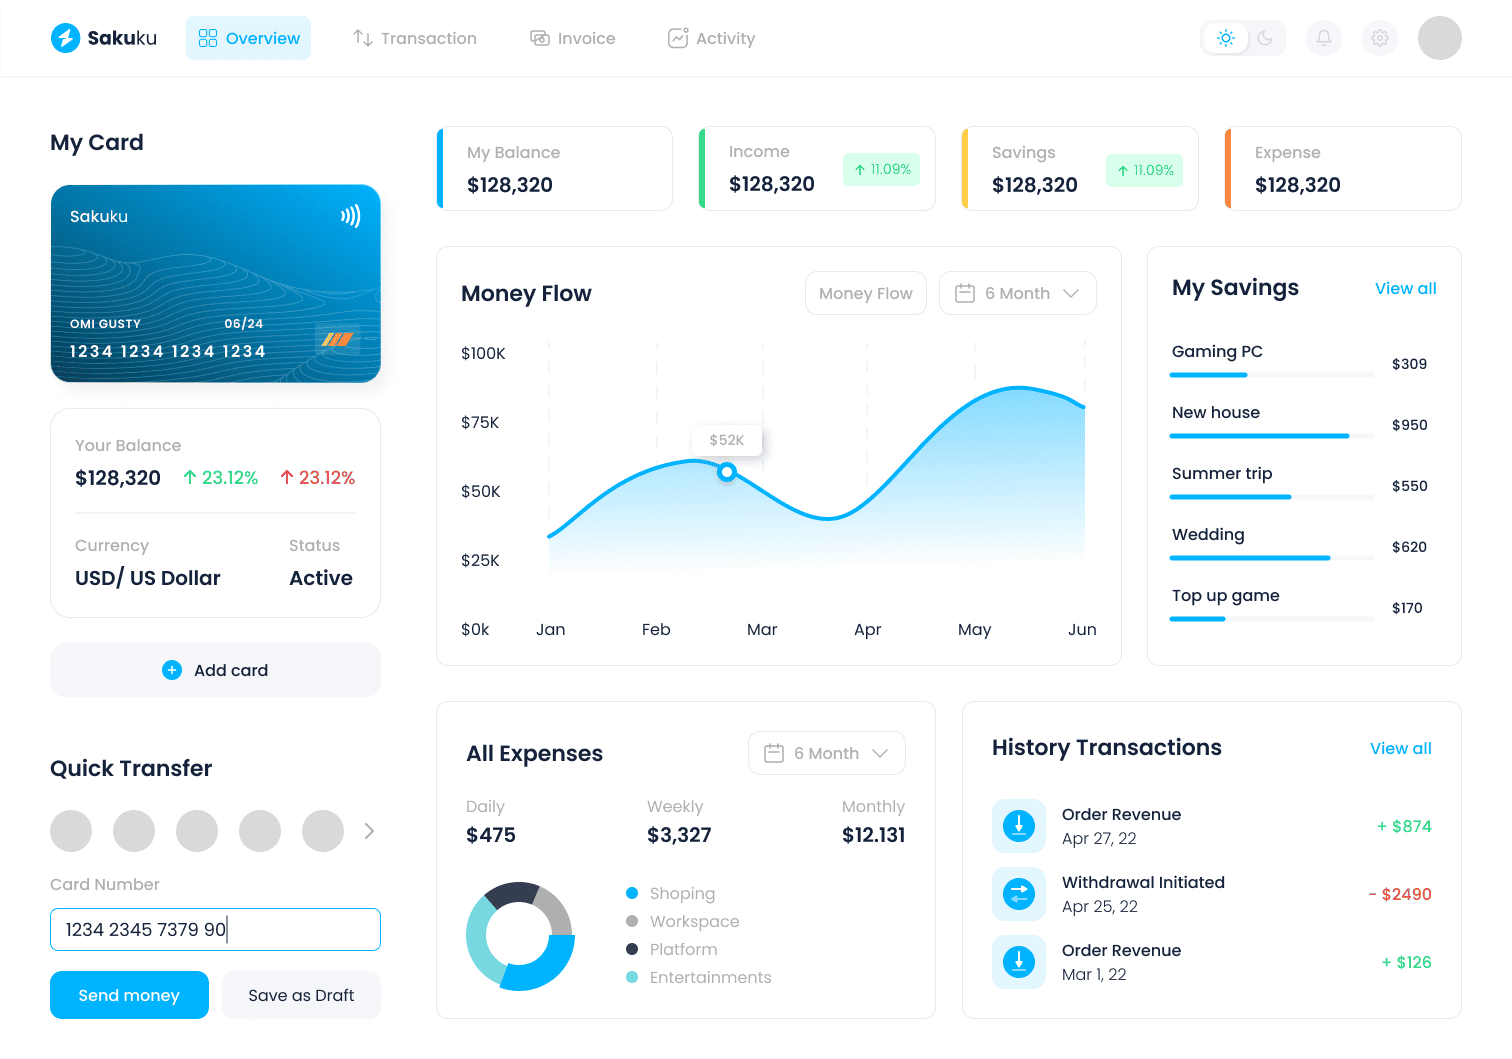
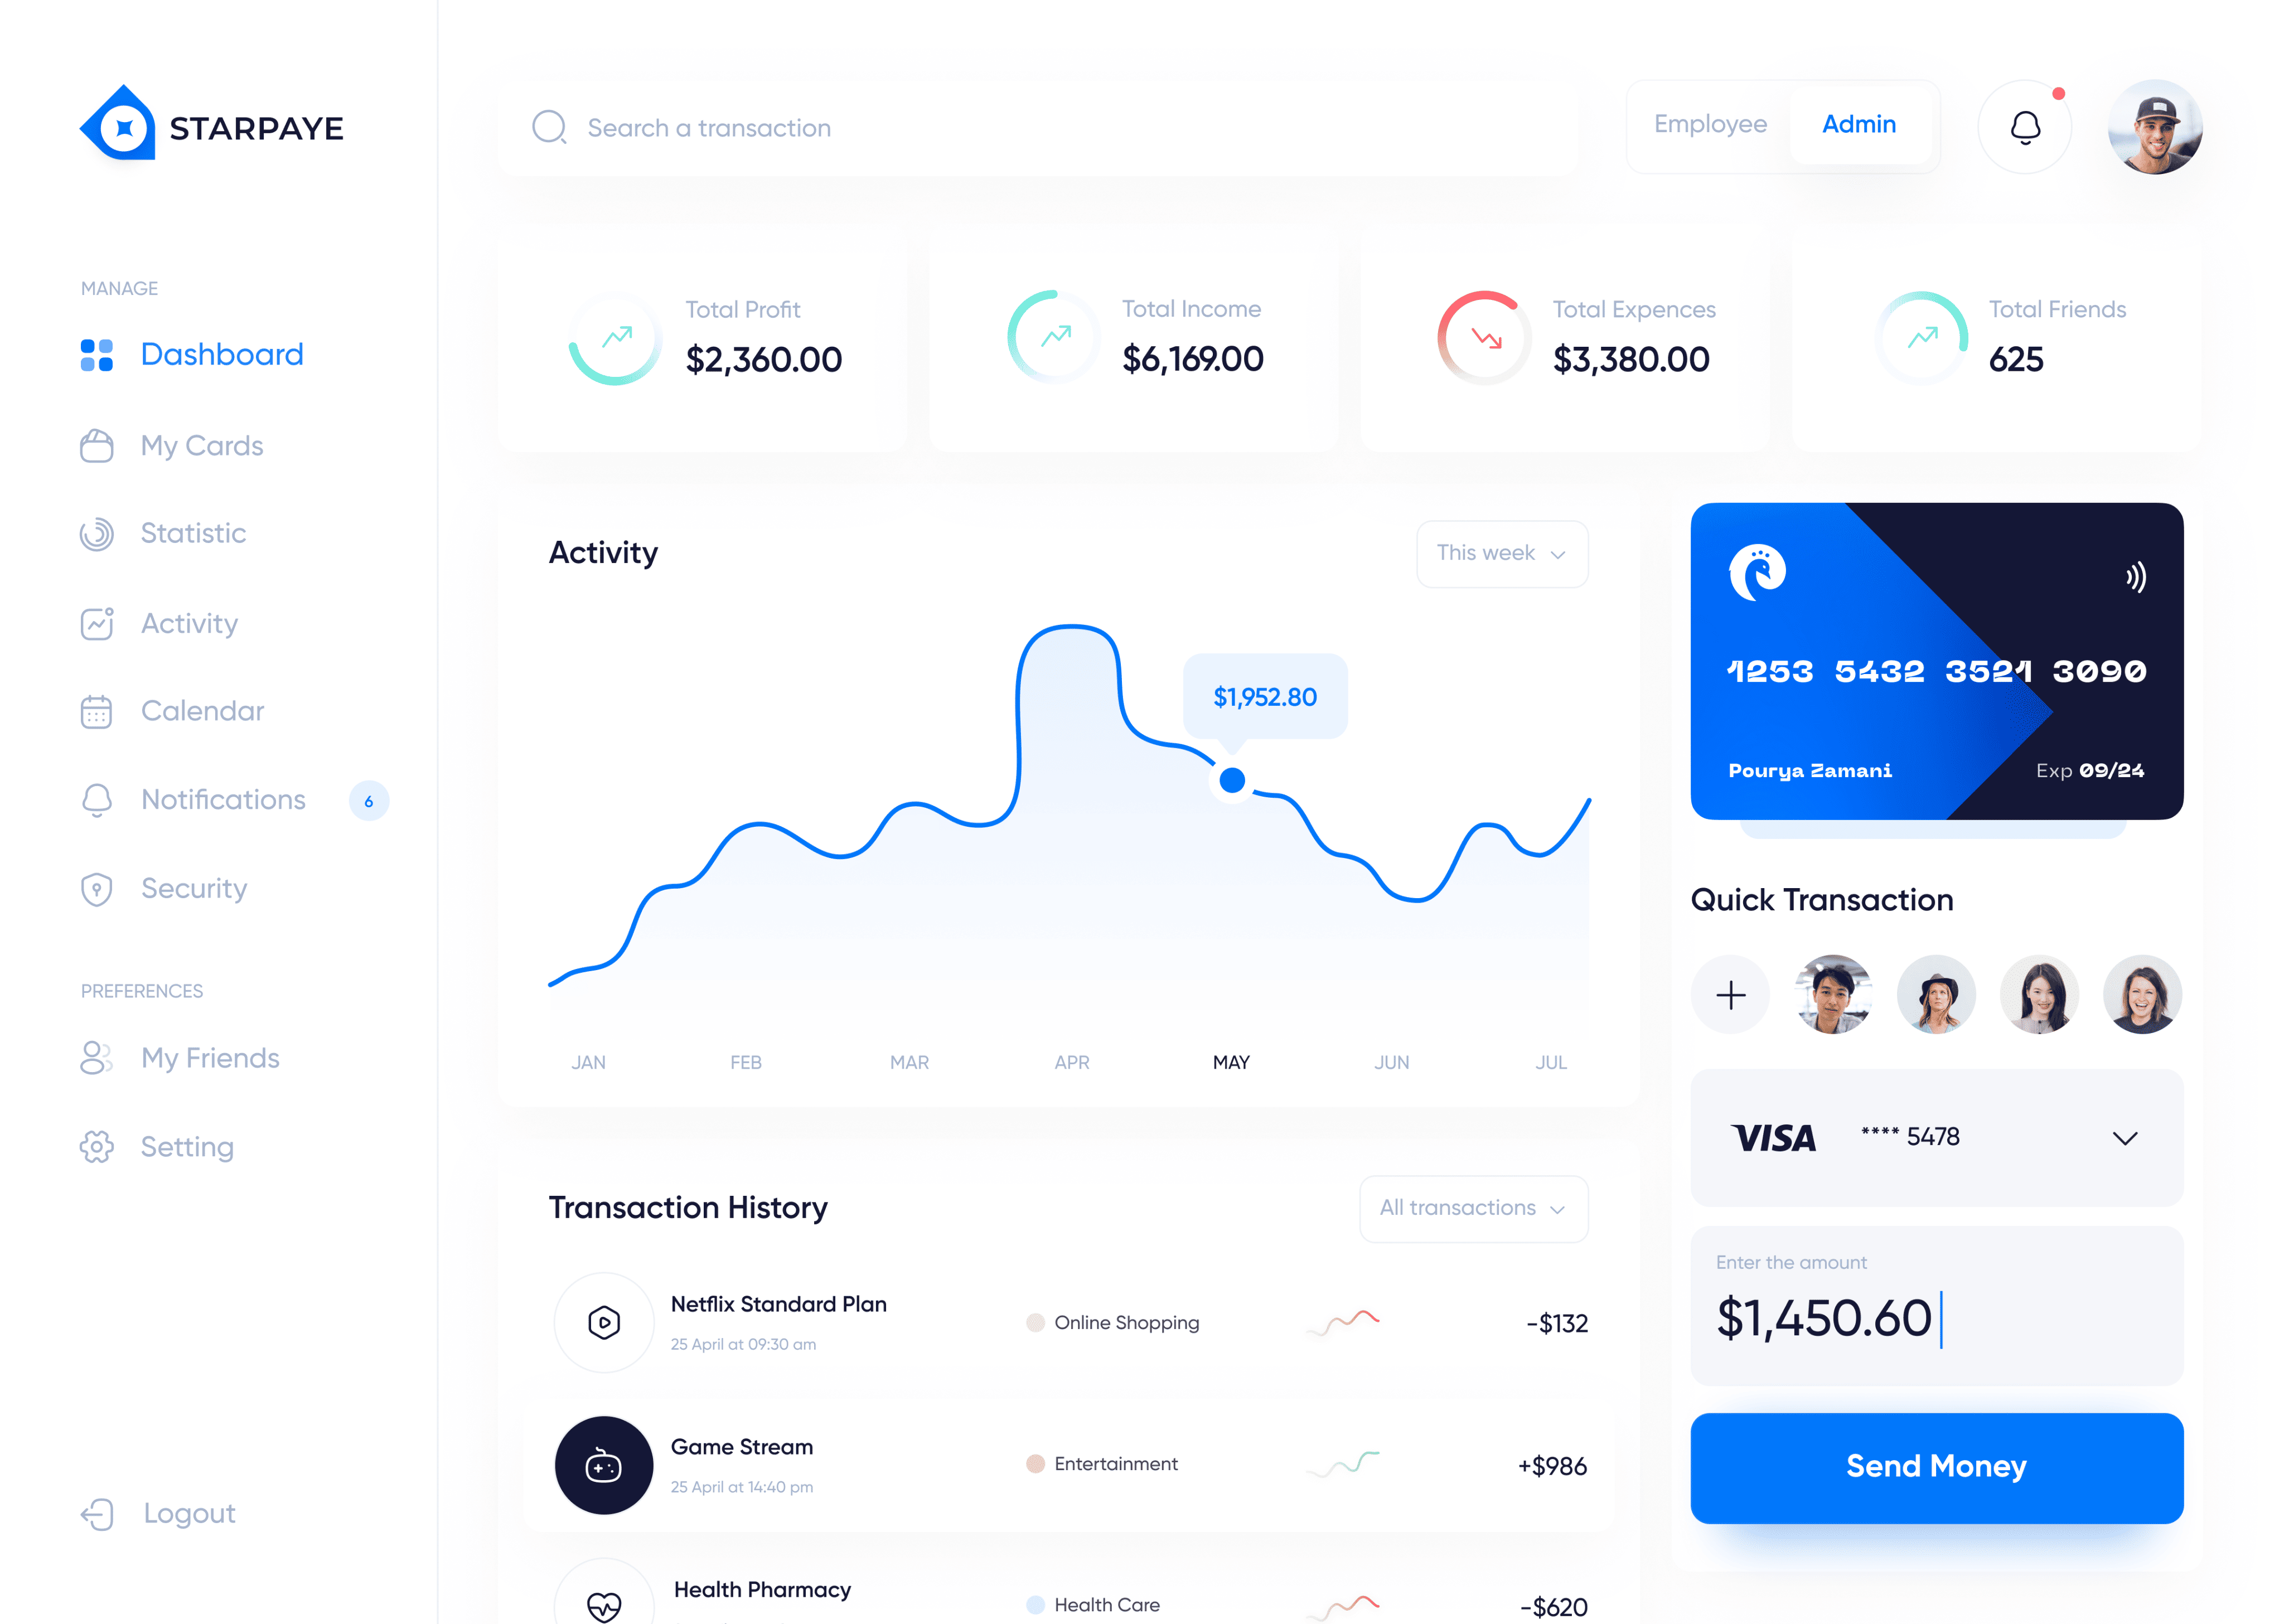
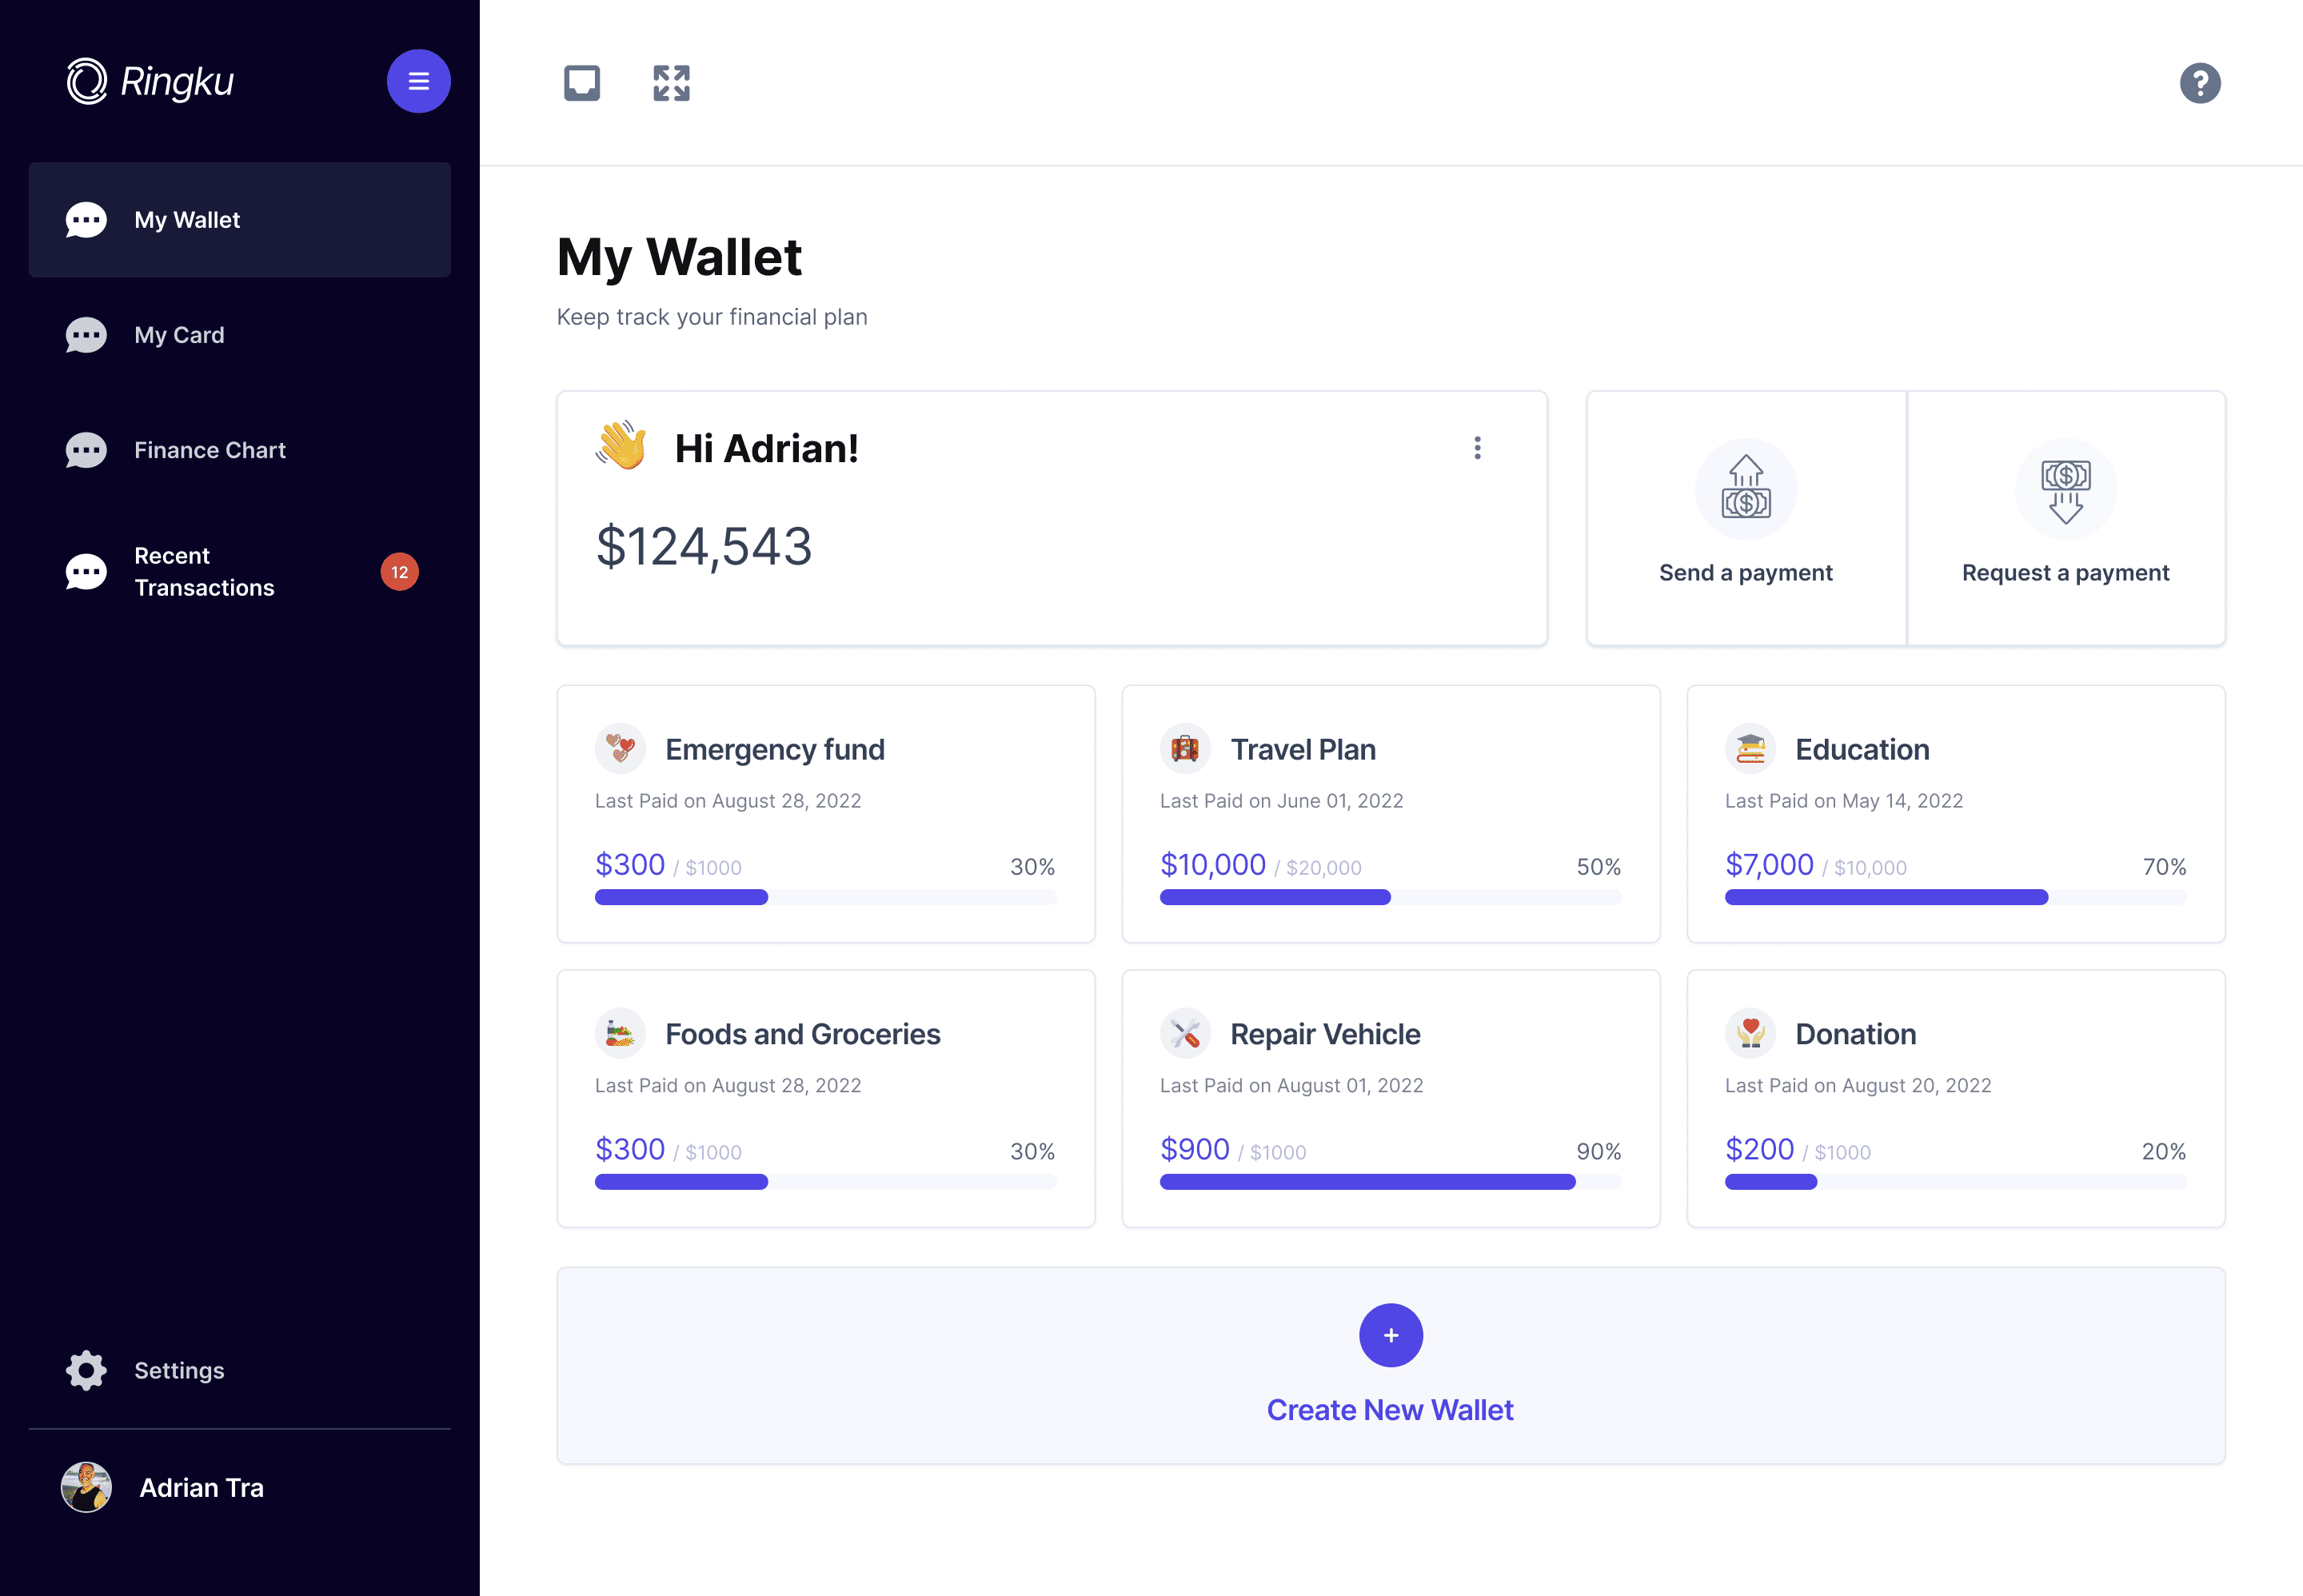
In banks and fintech, performance problems usually start small. One region drifts, one channel underperforms, or one onboarding step slows down. The cost is not only lost growth, but also a degraded customer experience that is hard to recover later. Fusedash generates a financial services dashboard that makes early drift visible and turns investigation into a repeatable workflow. Use it as a banking dashboard for branch and market visibility, or as a fintech dashboard for onboarding, activation, and digital transaction performance across mobile and web.

fusedash/ag.drone
Daily Performance Signals

What a Financial Services Dashboard Should Highlight Every Day

A good financial services dashboard behaves like an early-warning system. It points you to where the change started, not just confirms that totals moved.

Which metric shifted first: acquisition, activation, transactions, or service load?
Is the change concentrated in one region or spread across markets?
Did performance move in a channel (mobile, web, branch, partner) or a product line (cards, payments, deposits, lending)?
Are onboarding completion and time-to-activate improving or degrading?
Is transaction success rate stable, or are errors rising during peak periods?
What should happen next: drill down by segment, compare periods, or escalate to an owner?
Dashboard Views for Financial Services

The Financial Services Dashboard Views Teams Rely On

Leadership, regional owners, product teams, and operations teams need different lenses. These views reflect how banking and fintech teams actually investigate performance —each generated from a single connected data source.

Insights-Driven Platform
Leadership View

Executive performance dashboard

A clean overview of the core KPIs that matter, plus comparisons that show direction without noise across products, channels, and regions.

Branch & Region

Regional and branch performance dashboard

Compare branches and regions with ranked trends, then drill down to see which products and channels explain the change.

Product Growth

Product and channel dashboard

Track product adoption and digital usage across channels, then segment by customer type to see whether growth is coming from the right cohorts.

Service Health

Transaction reliability dashboard

Monitor transaction success rate and error rate alongside volume to detect service degradation early. Identify whether issues are concentrated in a channel, region, or product line and route the investigation to the right owner immediately.

Getting Started

How to Generate Your Financial Services Dashboard in Fusedash

Start with speed of diagnosis. The first financial services dashboard should tell you what moved and where it moved in minutes, then evolve into deeper views for product, region, and channel.

Insights-Driven Platform
01

Connect the data that explains movement

Import CSVs or connect APIs for customer activity, onboarding events, product usage, transaction outcomes, and operational signals. Standardize KPI definitions so teams trust the same numbers.

02

Start with one primary lens

Pick the lens that matches how you run the business: region, channel, or product. Add other lenses after the first view becomes part of the daily rhythm.

03

Create comparisons that expose drift

Use period comparisons (WTD vs last week, MTD vs prior MTD) and breakdown tables by region, segment, product, and channel to isolate the driver.

04

Add filters that match ownership

Filters for branch, region, channel, product line, segment, and timeframe make it easy to assign action to the right team without rebuilding reports.

Fusedash Builder

Generate dashboards teams can use daily: consistent KPI definitions, fast drill-downs, and shareable views for leadership and operators.

Start a free trial

Financial Services KPIs Teams Align On

Keep your financial services dashboard consistent by aligning on a small KPI set first. Then break it down by region, product line, channel, and segment to spot drift early and act fast.

Customer and growth: new customers, active customers, returning usage trend
Product performance: adoption and volume by product line and segment
Onboarding and activation: completion rate, time-to-activate, step drop-off
Service quality: transaction success rate, error rate, support load during peak periods
Need faster incident visibility? See real-time monitoring

Channel Performance Monitoring for Digital Banking and Fintech

When mobile or web performance slips, totals can hide the problem until churn rises. A channel performance view in your financial services dashboard tracks channel mix and key flow conversion so your team sees friction as it starts — not after it affects retention.

Conversion for key flows (sign up, verification, first action)
Drop-off by device type and channel
Peak-period performance and incident windows
Compare channels side-by-side to isolate where the change began

Regional Drift Detection for Banking Branches and Markets

Regional visibility turns 'we are down overall' into 'this market started drifting on Tuesday.' In a financial services dashboard, that clarity reduces broad investigations and makes ownership obvious — which means faster resolution and less impact on customers.

Rank regions and branches by trend, not only totals
See whether change is product-driven or channel-driven
Compare markets fairly using the same time windows
Share a filtered view with the regional owner responsible

Onboarding and Activation Monitoring for Fintech and Digital Banking

Growth in fintech and digital banking depends on completion rate and time-to-value. If onboarding slows, next month's activation numbers follow. Track each step in your financial services dashboard so teams can fix the driver before it hits retention.

Completion rate and time-to-activate trend
Step-level drop-off (verification, funding, first action)
Segment by region, channel, and customer type
Monitor sudden shifts after releases and campaigns
FAQs Section

Financial Services Dashboard FAQs

Common questions from banking and fintech teams building a financial services dashboard for performance monitoring and operational visibility.

What is a financial services dashboard?

A financial services dashboard is a single view of performance across products, channels, and regions. It helps banking and fintech teams spot drift early, isolate the driver behind a change, and align decisions using consistent KPI definitions.

What is a fintech dashboard?

A fintech dashboard is a real-time operational view that tracks the metrics fintech teams use to monitor product health and user growth: onboarding completion rate, time-to-activate, digital transaction success rate, channel performance across mobile and web, and product usage by cohort. Unlike a general financial dashboard that tracks revenue and expenses, a fintech dashboard focuses on the operational signals that predict whether growth is converting into active, retained users. In Fusedash, a fintech dashboard is generated from connected data sources and can be filtered by channel, region, product line, and customer segment.

What is a transaction reliability dashboard?

A transaction reliability dashboard monitors the health of digital transactions in real time — tracking success rate, error rate, volume, and latency across channels and product lines. It is designed to detect service degradation early, before errors accumulate into customer complaints or churn. Key signals include transaction success rate by channel (mobile, web, branch), error rate during peak periods, and comparison of current volume against recent baselines to spot anomalies. In financial services, a transaction reliability dashboard is typically used by operations and engineering teams during high-volume windows such as payroll periods, product launches, or promotional campaigns.

What is a banking dashboard?

A banking dashboard is a performance monitoring view designed for banks and financial institutions to track operations across regions, branches, products, and channels in one place. Key metrics in a banking dashboard include customer acquisition by region, product adoption by line of business, transaction success rate, onboarding completion, and service quality consistency across branches and digital channels. Banking dashboards are used by regional owners to monitor branch performance, by product teams to track adoption trends, and by leadership to get a consolidated view of where performance is drifting before it affects customer experience.

What is the difference between a banking dashboard and a fintech dashboard?

A banking dashboard focuses on regional and branch performance, product mix, and service quality consistency across channels — giving regional owners and leadership one view of how each market is performing. A fintech dashboard focuses on onboarding completion, activation rates, digital transaction performance, and product usage trends across mobile and web, giving product and growth teams visibility into where users convert and where they drop off.

Which KPIs should I include first?

Start with customer activity, onboarding completion, channel mix, product usage, and transaction success rate. Then break them down by region, branch, product line, and segment.

Can I filter dashboards by region, branch, product, or channel?

Yes. Filter by region and branch for ownership, then drill down by product and channel (mobile, web, branch, partner) to pinpoint where the change started and which segment is responsible. For a geographic view, open maps.

What data sources can I connect to for banking and fintech reporting?

Start from exports (CSV) for faster setup, then expand to connected sources and APIs as your workflow matures. The goal is one definition of each KPI so the same numbers show up across leadership views and team-level drilldowns.

Is this the same as a finance dashboard for budgeting and forecasting?

No. This page covers financial services performance and operational monitoring — product adoption, onboarding completion, transaction reliability, channel performance, and regional drift across banking and fintech operations. For budgeting, planning, close reporting, and forecast variance analysis, see the Finance Teams dashboard.

Can I share this dashboard with stakeholders?

Yes. Share a consistent view so leadership and teams use the same KPI definitions. For stakeholder-ready narrative updates, see storytelling.

Ready to Generate Your Financial Services Dashboard?

Monitor banking and fintech performance across products, channels, and regions. Track onboarding completion, transaction reliability, and channel drift in one connected view — then drill down to the driver in minutes.