Client Reporting Dashboards That Prove Impact.

The client dashboard platform for agencies who want to prove impact, not just show activity.

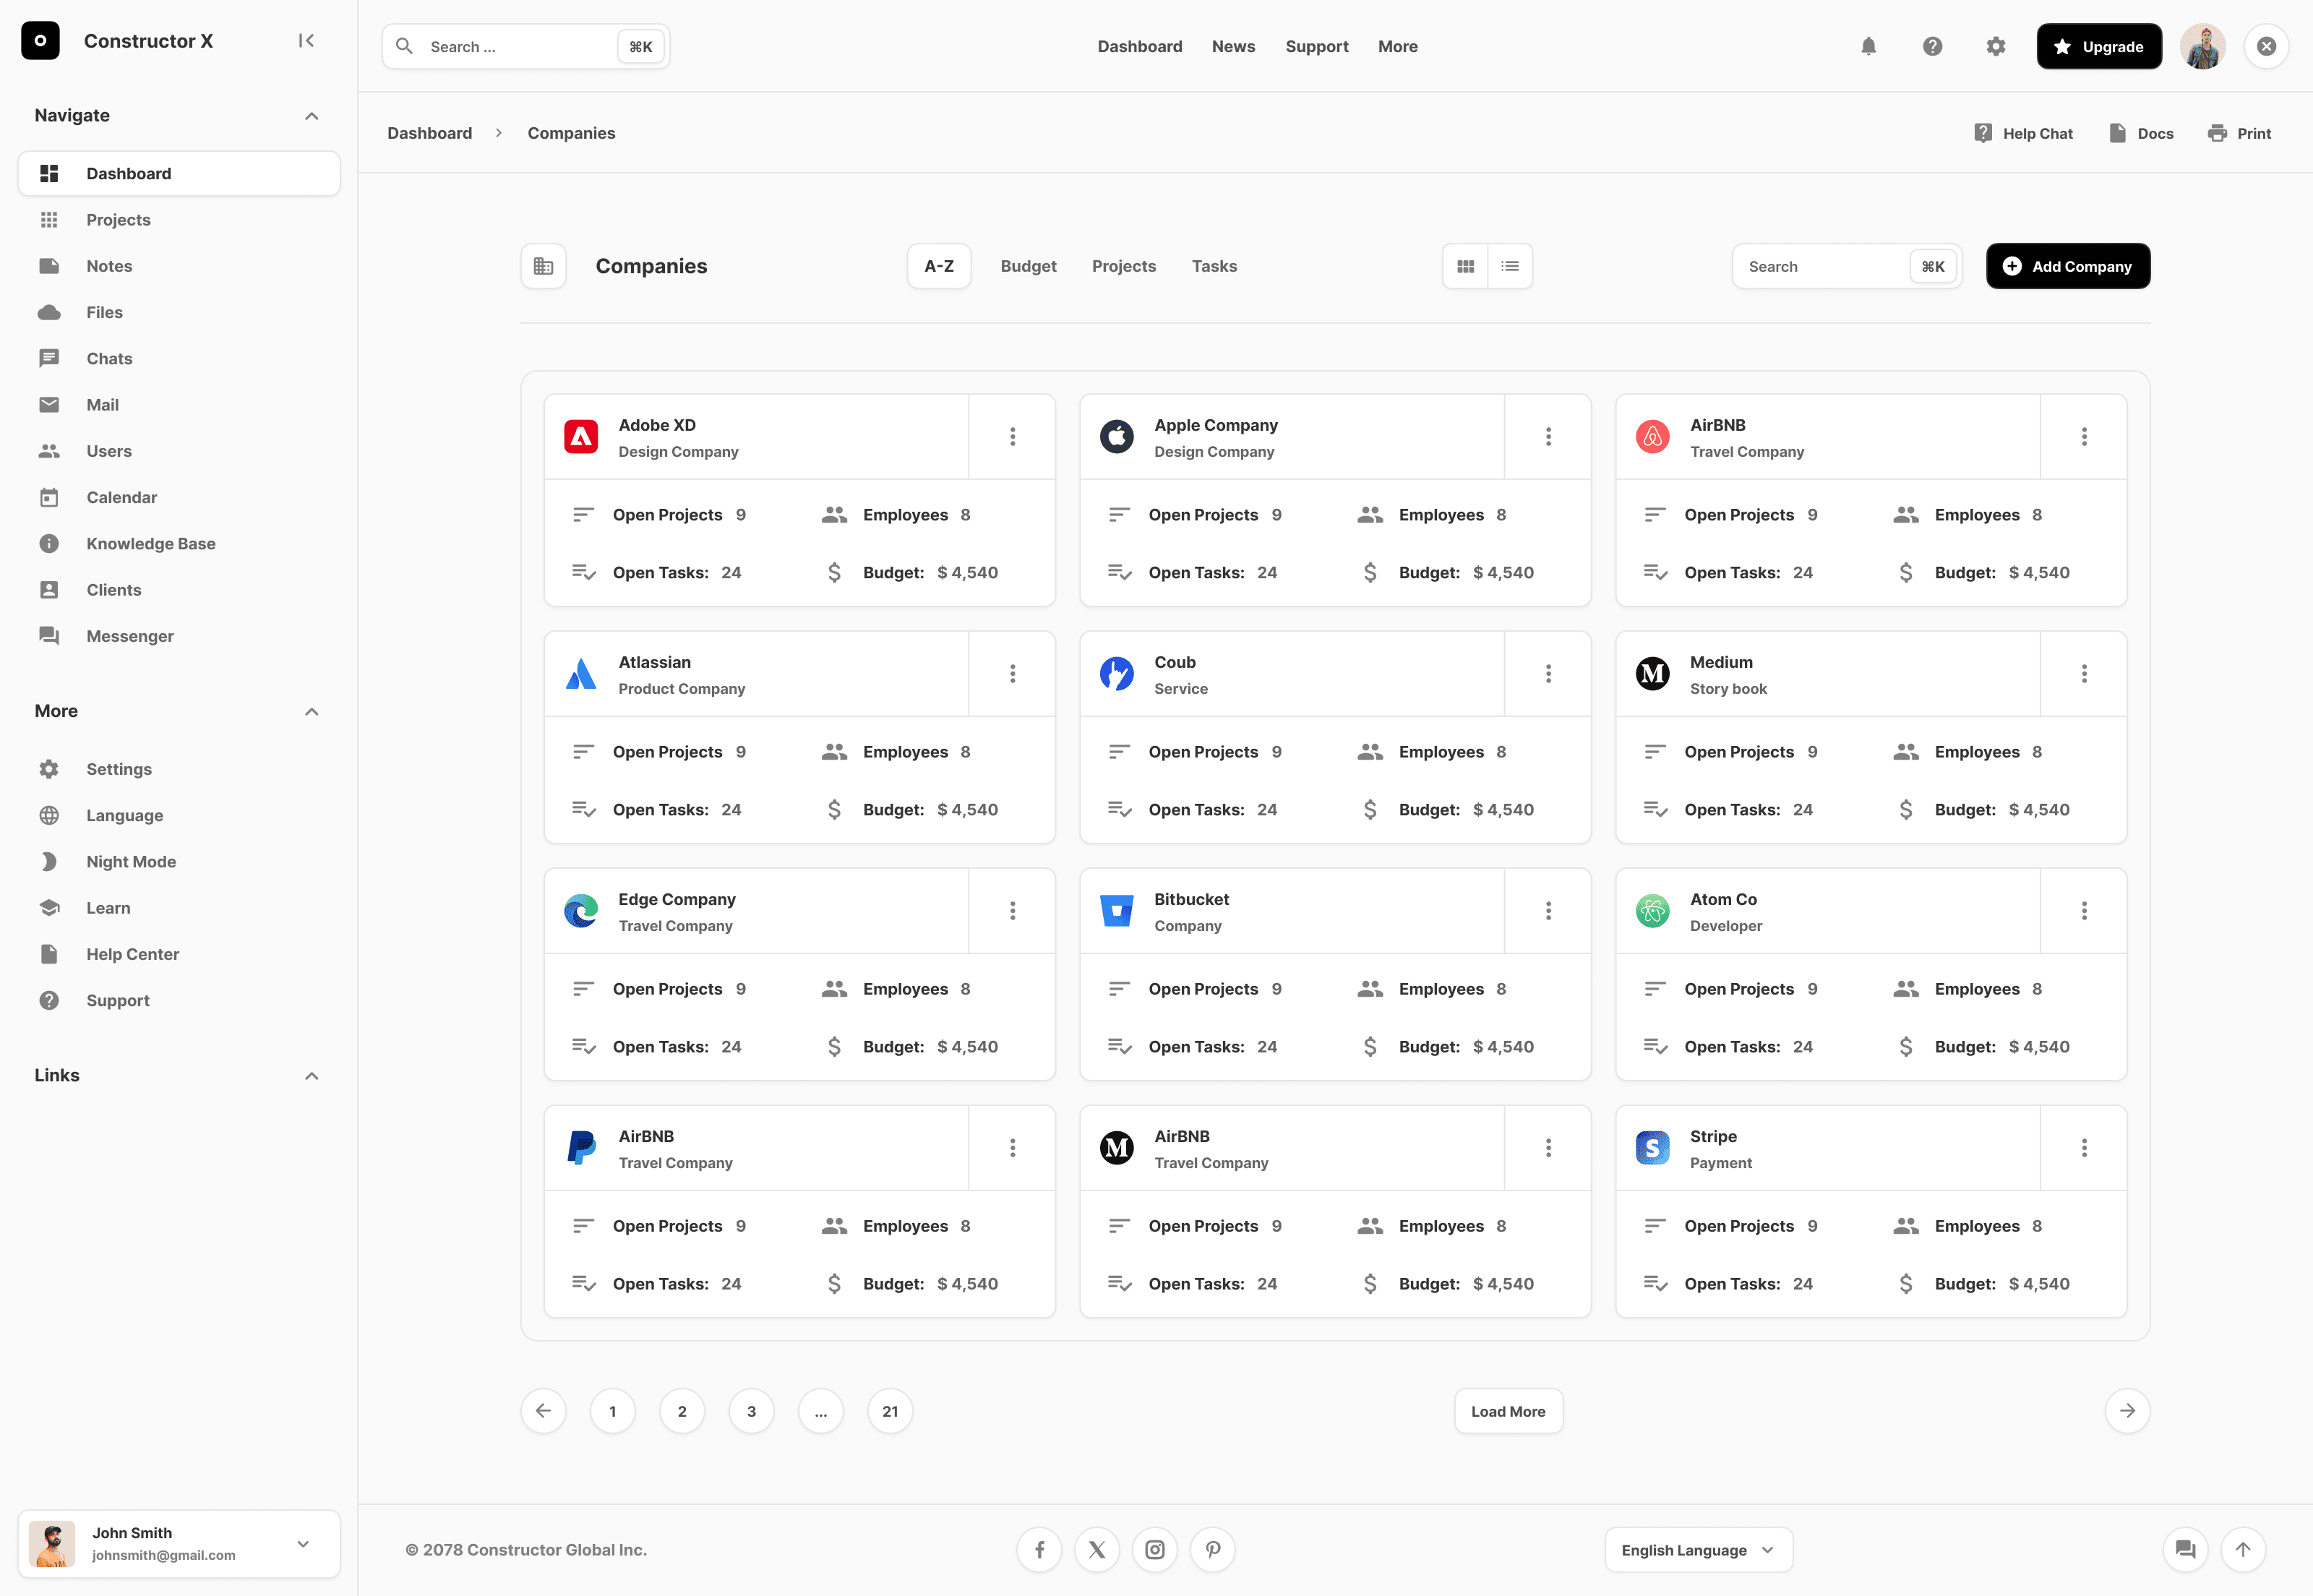
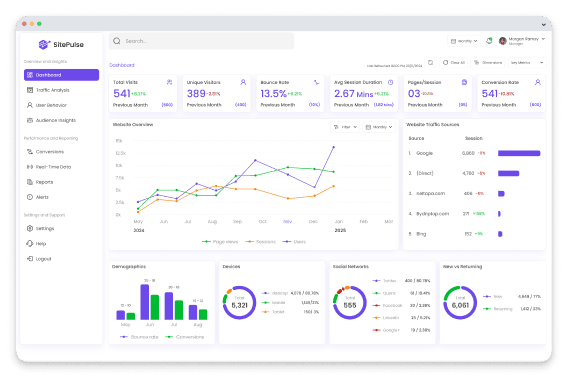
Use it as a marketing reporting dashboard for daily optimization, and as an agency reporting dashboard for monthly reporting and QBRs. If you manage multiple accounts, it also works as a client dashboard platform that standardizes KPIs across every client without rebuilding reports from scratch.

fusedash/ag.drone
Client Questions to Answer Every Review

What a Client Dashboard Should Make Obvious in Every Review

The point of client reporting is not to show activity. It is to prove impact and guide decisions. A good client reporting dashboard lets agencies lead the conversation instead of reacting to client questions one by one.

Did we hit the agreed targets, and what moved since last period?
Where did results come from: channel, campaign, landing page, or location?
Are we buying growth efficiently, or are costs rising faster than outcomes?
Which changes matter: tracking, creative, targeting, offer, or funnel friction?
What is the plan for next month: scale, fix, or reposition?
What should the client do next on their side to improve conversion?
Agency Reporting Views

The Agency Reporting Dashboard Views Teams Actually Deliver

You need views that work for two audiences: clients who want clarity and internal specialists who want control. These four views cover both — each generated from a single connected data source.

Agency Reporting Views

The Agency Reporting Dashboard Views Teams Actually Deliver

You need views that work for two audiences: clients who want clarity and internal specialists who want control. These four views cover both — each generated from a single connected data source.

Insights-Driven Platform
Client Summary

Executive client reporting dashboard

A clean monthly view of outcomes, efficiency, and direction: leads or revenue, CPL or CAC, ROAS, and a short “what changed” summary versus the previous period.

Paid Media

Campaign performance dashboard

Break down spend, conversions, CPL, CAC, and ROAS by campaign and channel so your team knows what to scale, pause, or rebuild.

Funnel and Landing Pages

Conversion diagnostics dashboard

Connect traffic to leads and revenue. Segment by landing page, device, location, and campaign to find where drop-offs start and what to test next.

SEO and Content

SEO performance dashboard (visibility to outcomes)

Track organic visibility and traffic as supporting signals, but tie reporting back to leads, assisted conversions, and revenue when data is available.

Getting Started

How to Generate Your Client Reporting Dashboard in Fusedash

The fastest way to lose trust is inconsistent KPI definitions across reports. Start with agreed KPIs first, then expand into deeper diagnostics.

Getting Started

How to Generate Your Client Reporting Dashboard in Fusedash

The fastest way to lose trust is inconsistent KPI definitions across reports. Start with agreed KPIs first, then expand into deeper diagnostics.

Insights-Driven Platform
01

Connect the sources clients care about

Bring together ad spend, analytics, conversion events, and lead outcomes from your CRM or call tracking. Start with what explains results clearly.

02

Standardize KPIs across all accounts

Define what counts as a lead, qualified lead, and conversion. Align attribution logic and naming conventions so dashboards stay consistent month to month.

03

Create two layers: client view and operator view

Generate a client-facing summary for clarity, then deeper views for campaign, funnel, and landing page diagnosis. This keeps client calls simple and keeps internal execution fast.

04

Add filters so clients can explore without breaking the story

Add filters for timeframe, channel, campaign, device, and location. Stakeholders can explore safely without changing the KPI baseline.

Fusedash Builder

Generate agency dashboards you can reuse: consistent KPI definitions, fast drill-downs, and shareable links that reduce reporting time and improve client retention.

Start a free trial

Agency KPIs Clients Actually Care About

A client reporting dashboard works best when you lead with outcomes, then explain the drivers. Start with these KPIs, then break them down by channel, campaign, landing page, and location so clients understand what changed and what to do next.

Leads, qualified leads, bookings, and revenue (when available)
CPL, CAC, ROAS, and cost per opportunity (if tracked)
Landing page conversion rate, form completion, and call rate
Pipeline value, lead-to-opportunity rate, and close rate (if tracked)

Automated Client Reporting That Scales Across Every Account

Agencies waste hours copying the same reporting logic into new spreadsheets or slide decks. A client dashboard platform automates that structure — reuse a proven layout, swap in each client's data sources, and eliminate manual formatting entirely.

Standard dashboard layout across all clients
Consistent KPI definitions that prevent “number debates”
Separate internal diagnostic views from client-facing views
Less time formatting, more time improving performance

Turn Client Reporting Into a Narrative Clients Understand

The best client reporting dashboards don't just show metrics. They explain what changed, make next steps explicit, and reduce the back-and-forth that costs agencies time and clients confidence.

Show what changed versus last month and why it changed
Highlight wins and risks with context, not spin
Convert insights into a short action plan for the next period
Keep stakeholders aligned on the same source of truth

Answer Client Questions Faster with AI Data Chat

Client calls often include 'Can you break this down by location?' or 'Which campaigns drove this lift?' Use AI Data Chat to generate the right breakdown without building a new report while everyone waits.

Ask: “What changed vs last month and what caused it?”
Break down by campaign, device, or location in seconds
Find why efficiency shifted when spend or conversion rate moved
Save the answer as a reusable view for the next report
FAQs Section

Client Dashboard FAQs

Common questions from agencies building a client reporting dashboard, agency reporting dashboard, or marketing reporting dashboard for recurring client reporting and QBRs.

FAQs Section

Client Dashboard FAQs

Common questions from agencies building a client reporting dashboard, agency reporting dashboard, or marketing reporting dashboard for recurring client reporting and QBRs.

What is a client dashboard?

A client dashboard is a performance reporting view that agencies share with clients to communicate results clearly and consistently — replacing ad hoc screenshots, spreadsheets, and slide decks with a single live view that answers the questions clients actually ask. A good client dashboard focuses on outcomes (leads, revenue, ROAS, CPL) rather than activity metrics, explains what changed versus the previous period, and makes next steps explicit so clients understand what the agency will do and what they need to do on their side.

What is a client reporting dashboard?

A client reporting dashboard is an automated, always-current view of campaign performance that agencies share with clients to replace manual reports, slide decks, and spreadsheet exports. It is designed to answer the questions clients ask most often — did we hit our targets, what changed, why did it change, and what happens next — in a format clients can read without needing to interpret raw data. A good client reporting dashboard separates outcomes (leads, revenue, ROAS) from activity metrics (impressions, clicks) so clients focus on what their investment produced, not on channel-level detail that only specialists need to understand.

What is an agency reporting dashboard?

An agency reporting dashboard is a structured reporting view that agencies use to deliver consistent, branded performance updates to clients across all managed accounts. It is distinct from an internal analytics tool: where an internal dashboard is built for analysis and diagnosis, an agency reporting dashboard is built for communication — explaining what happened, why it matters, and what the agency plans to do next. Agencies use a single reporting framework across all accounts, swapping in each client's data sources, so reporting stays consistent and scalable as the account portfolio grows.

What is a marketing reporting dashboard for agencies?

A marketing reporting dashboard for agencies is a channel-level performance view that connects paid media, SEO, email, and content data into one client-facing report — replacing the need to pull screenshots from each platform separately. It tracks the KPIs marketing clients care about most: leads, CPL, ROAS, conversion rate, and channel mix, with period comparisons so clients can see what improved and what needs attention. Agencies use a marketing reporting dashboard as the working layer beneath the executive client summary — diving into channel performance for optimization decisions while keeping the client summary focused on outcomes.

What is a client dashboard platform?

A client dashboard platform is a reporting infrastructure that lets agencies manage, generate, and share dashboards across their entire client portfolio from a single system. Unlike a single-client dashboard tool, a client dashboard platform supports multi-account management — standardizing KPI definitions, reusing reporting layouts, and maintaining separate data views for each client without rebuilding from scratch each month. Key capabilities of a client dashboard platform include automated data connections, shareable links, white-label presentation options, and the ability to generate both client-facing summary views and internal diagnostic views from the same data source.

How do agencies structure a client dashboard to work for two audiences?

Agencies that report to both clients and internal specialists need two distinct dashboard layers. The client-facing layer is a summary view that covers outcomes: goals achieved, KPI movement versus the previous period, and a short explanation of what changed and why. It is designed to be read in minutes without background in the underlying channels. The internal diagnostic layer covers campaign performance, funnel analysis, landing page conversion, and spend efficiency — the detail specialists need to optimise, but which can overwhelm or confuse clients when presented without context. Building both layers from a single data source keeps definitions consistent, prevents the 'different numbers' problem, and allows agencies to move between layers during a client call without switching tools.

What should a client reporting dashboard include first?

Start with a simple structure: goals, KPI summary, trend vs previous period, and the top drivers behind change. Then add channel sections (PPC, SEO, email, social) only if they connect directly to the outcome.

How do agencies avoid overwhelming clients with metrics?

Use a three-layer approach: a headline summary for executives, a channel view for marketing owners, and drill-downs only when someone asks “why.” For stakeholder-friendly narrative updates, use Storytelling

Can I create a white-label client dashboard (branded client portal)?

Yes. A white-label client dashboard presents the reporting workspace under the agency's brand — using consistent naming, custom layouts, and share settings so clients see an agency-owned reporting environment rather than a third-party tool. This is particularly valuable during onboarding and QBRs where brand consistency builds trust. In Fusedash, agencies can configure their client dashboard platform with consistent visual layouts and share settings across all accounts.

Ready to Generate Client Dashboards Your Clients Trust?

Generate a client reporting dashboard that proves impact, explains what changed, and makes next steps clear. Reduce manual reporting time and standardize KPI definitions across every account.