Executive Dashboard for Revenue, Pipeline and Business Health.

See What Changed, What Is at Risk, and What to Decide Next.

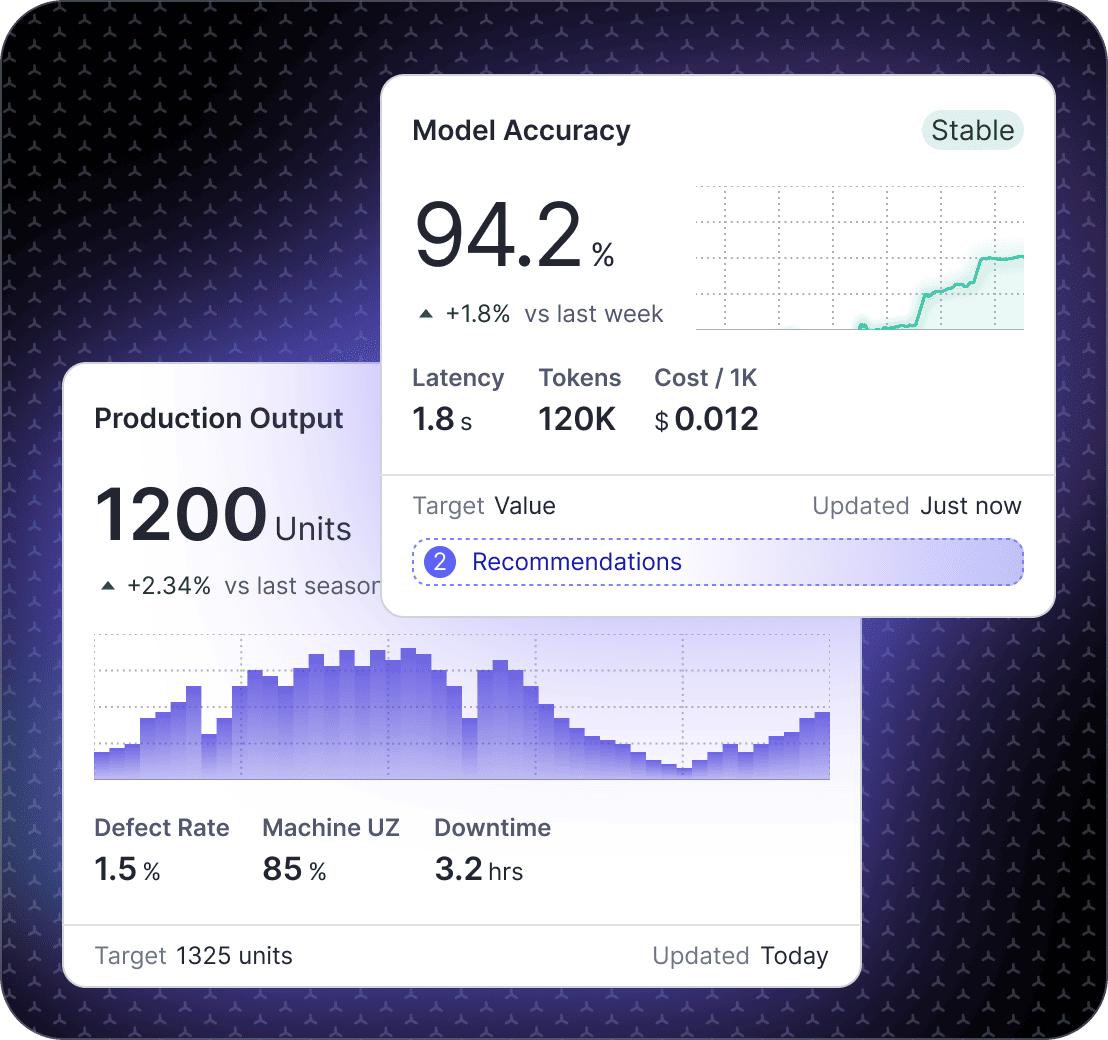
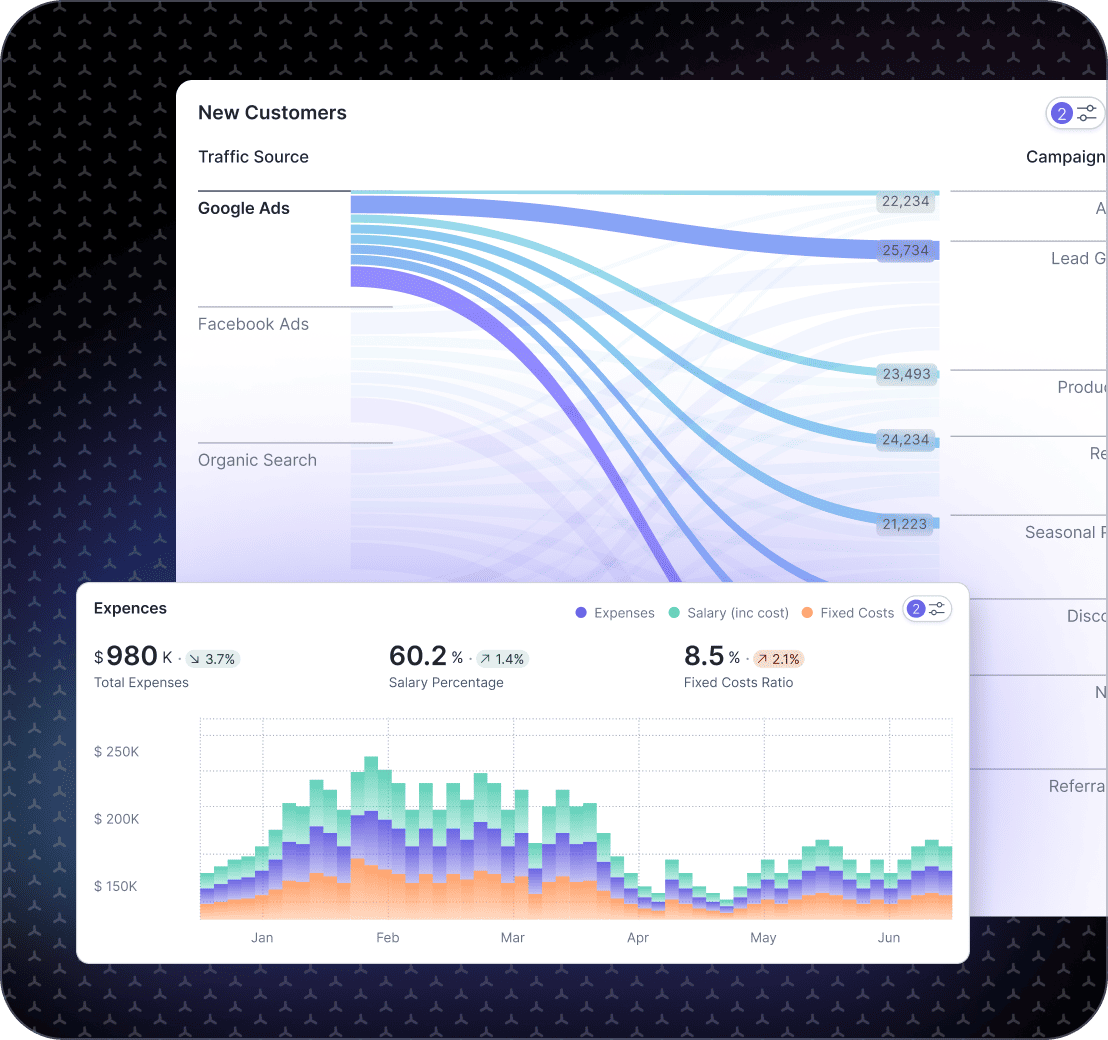
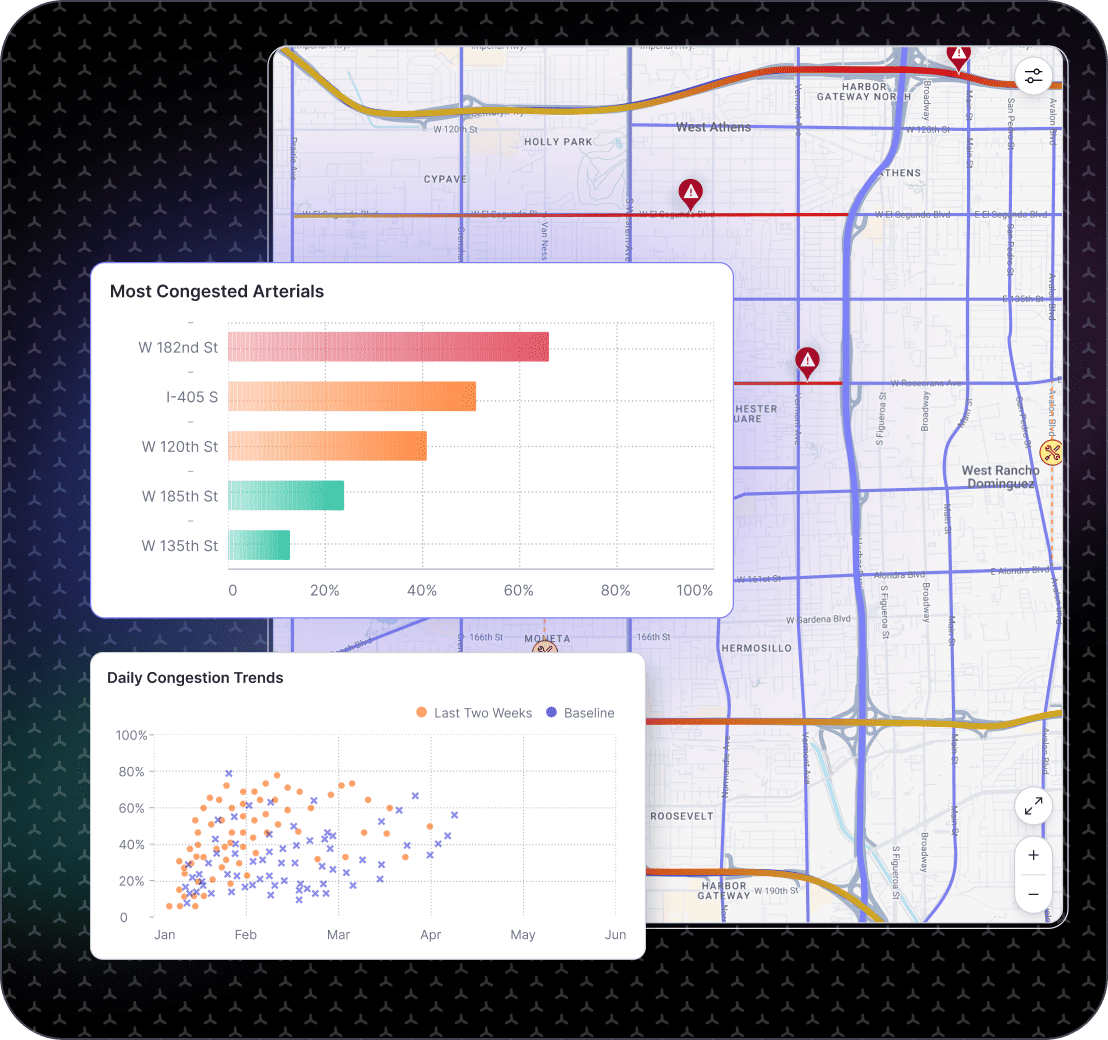
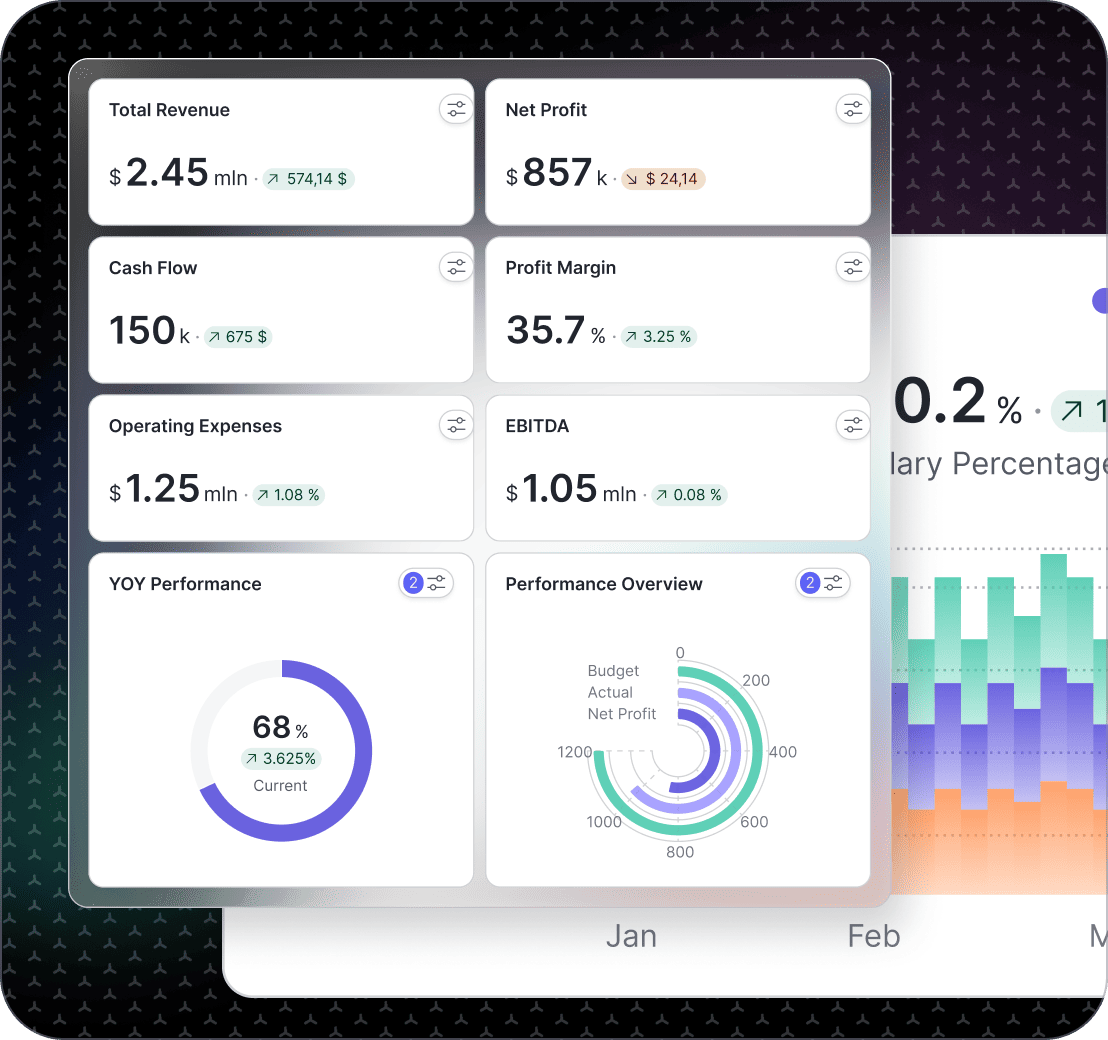
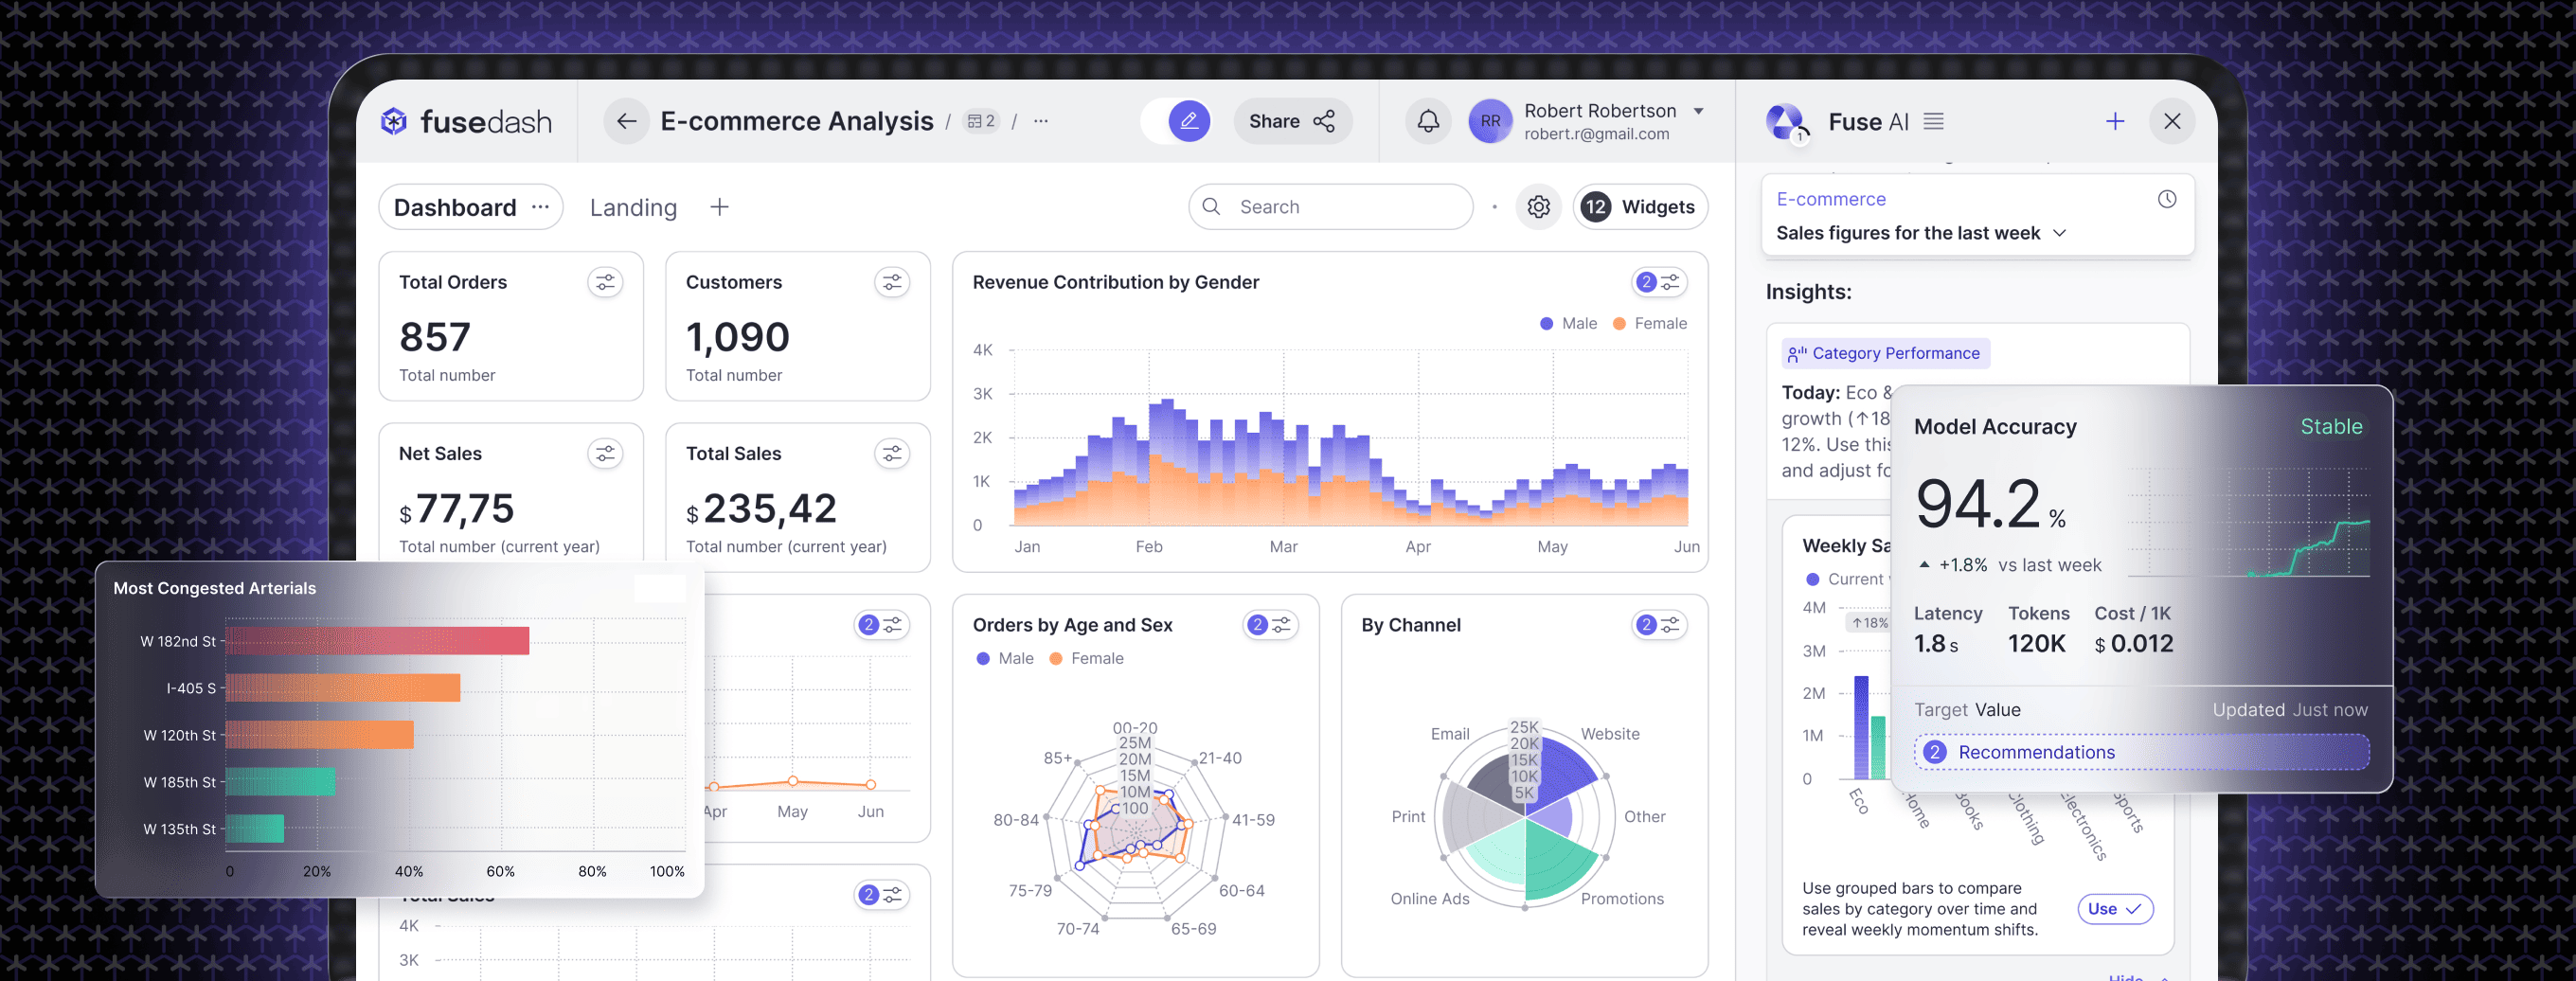
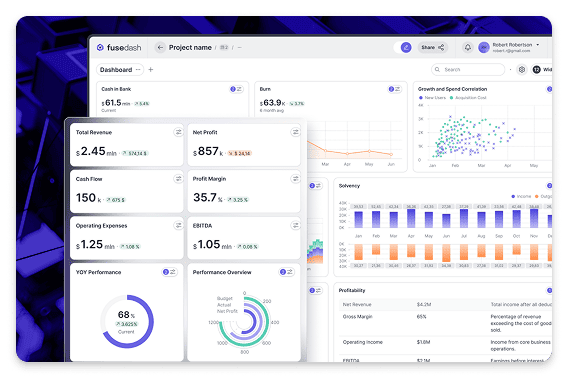
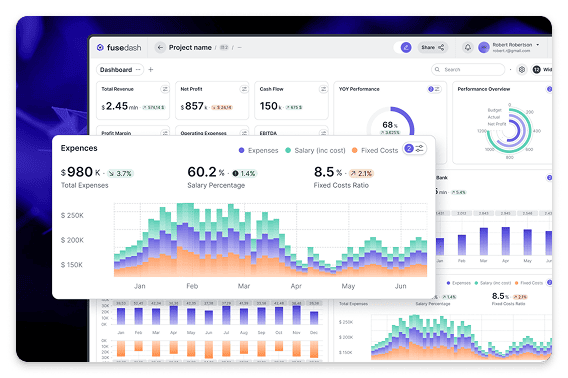
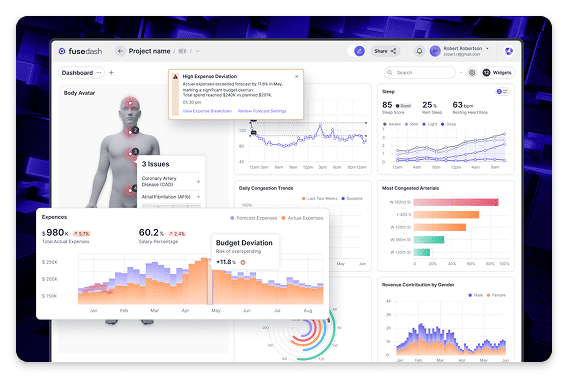
Leadership does not need more dashboards. You need one executive dashboard that makes the business state obvious, highlights what changed, and supports the next decision. Fusedash generates an executive reporting dashboard that pulls your core metrics into a single view, with trends, comparisons, and drill-downs when you need detail. Use it as a CEO dashboard for weekly leadership reviews, a leadership dashboard for cross-team alignment, and a recurring executive dashboard reporting view for monthly business reviews that stays consistent even as your team grows.

fusedash/ag.drone
Leadership Review Questions

What Your Executive Dashboard Should Answer Before the Meeting Starts

A strong executive dashboard gives you clarity before the meeting starts. It tells you if the business is healthy, where it is drifting, and what deserves attention and a decision today.

Leadership Review Questions

What Your Executive Dashboard Should Answer Before the Meeting Starts

A strong executive dashboard gives you clarity before the meeting starts. It tells you if the business is healthy, where it is drifting, and what deserves attention and a decision today.

Are we ahead or behind plan, and what moved since last period?
Is growth coming from pipeline, conversion, retention, or price and mix?
Are we accumulating risk in cash, churn, support load, or delivery capacity?
Which segment, region, or product line explains the change?
What is the next decision: invest, cut, fix, or wait for more signal?
What should each leader own after this review?
Executive Dashboard Views

The Executive Dashboard Views Leadership Teams Actually Use

Leadership needs a small set of recurring views that stay stable across quarters: not a new dashboard every month. These are the executive dashboard views most leadership teams adopt first.

Executive Dashboard Views

The Executive Dashboard Views Leadership Teams Actually Use

Leadership needs a small set of recurring views that stay stable across quarters: not a new dashboard every month. These are the executive dashboard views most leadership teams adopt first.

Insights-Driven Platform
Business Health

Executive summary dashboard

A one-page view of top KPIs with trends and comparisons that show direction without noise, plus a short “what changed” snapshot.

Revenue and Pipeline

Revenue and pipeline dashboard

Track revenue, pipeline value, conversion, and forecast direction signals so leadership can see whether growth is building or stalling.

Customer Health

Customer health dashboard

Monitor retention direction, expansion signals, and support load indicators so risks are visible before they become churn.

Execution and Delivery

Operations performance dashboard

A leadership lens on capacity, cycle time, and delivery reliability signals, so resourcing decisions are grounded in reality.

Getting Started + Builder

How to Generate Your Executive Dashboard in Fusedash

Executive dashboards fail when they try to include everything. Start with a decision-ready core, then expand only when the view proves useful in real leadership reviews.

Getting Started + Builder

How to Generate Your Executive Dashboard in Fusedash

Executive dashboards fail when they try to include everything. Start with a decision-ready core, then expand only when the view proves useful in real leadership reviews.

Insights-Driven Platform
01

Connect the systems that define business performance

Pull in the metrics leadership relies on, such as revenue, pipeline, cash signals, retention, and service health. Start with the minimum needed to explain change clearly.

02

Agree on KPI definitions and owners

Define what counts as revenue, pipeline, churn, and customer health. Assign owners so the dashboard drives accountability, not debates.

03

Create comparisons that make drift obvious

Use week-to-date, month-to-date, and prior-period comparisons so leadership can see direction quickly and ask better questions.

04

Add drill-down paths, not clutter

Keep the executive view clean, then let leaders drill into segment, region, product line, or funnel stage when the headline changes.

Fusedash Builder

Create an executive dashboard your leadership team will actually use: clear KPI definitions, fast drill-downs, and consistent reporting that survives growth.

Start a free trial

KPIs Leadership Teams Align On First

An executive dashboard becomes decision-ready when it shows outcomes and early-warning signals in the same view. Start with these KPIs, then break them down by region, product line, or segment when something moves.

Revenue trend, gross margin direction, and variance vs plan
Pipeline value, win rate, and sales cycle movement
Cash signals and runway direction (based on your inputs)
Customer health signals, retention direction, and support load trend

What Changed, Why It Changed, and What to Do Next

Executive reporting breaks down when leaders get totals without context. Generate a view that connects each change to a driver so decisions are faster, ownership is clearer, and meetings end with actions.

Period comparisons that highlight the shift clearly
Breakdowns by segment, product line, region, or channel
Simple notes that capture the driver behind the change
A clear next action tied to an owner

Real-Time Visibility for Fast-Moving Business Risks

Some risks are too expensive to discover at month-end. Real-time monitoring helps leadership spot early drift and respond while impact is still manageable.

Sudden pipeline drop or conversion rate change after launches
Support spikes that signal customer experience risk
Operational bottlenecks that threaten delivery timelines
Revenue anomalies during promotions or billing cycles

Leadership Alignment Without Reporting Chaos

Executive dashboard reporting breaks when every team brings a different number to the meeting. Generate one shared view with consistent definitions so decisions are faster, ownership is clear, and follow-ups are automatic.

One set of KPI definitions used across teams and reports
Shared views for leadership, finance, sales, and operations
Notes and decisions captured next to the metrics that triggered them
Clear follow-ups tied to owners and review cadence
FAQs Section

Executive Dashboard FAQs

Common questions from business leaders building an executive dashboard, CEO dashboard, leadership dashboard, or executive reporting dashboard for recurring reviews.

FAQs Section

Executive Dashboard FAQs

Common questions from business leaders building an executive dashboard, CEO dashboard, leadership dashboard, or executive reporting dashboard for recurring reviews.

What is an executive dashboard?

An executive dashboard is a cross-functional view of business performance that gives leadership teams a shared, consistent picture of revenue direction, pipeline health, cash signals, and customer risk — in one place, on a recurring schedule. A good executive dashboard shows outcomes and early-warning signals together: not just what the numbers are, but what changed versus the prior period, which segment or region drove the change, and what decision the shift requires. It is built for leadership reviews and decision-making, not for team-level operational monitoring — for that, see the Marketing, Finance, and Operations dashboards.

What is executive dashboard reporting?

Executive dashboard reporting is the practice of sharing a consistent, structured business performance view with leadership teams on a recurring schedule: weekly, monthly, or quarterly. that reviews start from a shared set of facts rather than from individually compiled reports. It combines a live dashboard (for current state and trend) with a short narrative layer (for context, interpretation, and next actions) so leaders arrive at meetings already oriented on what changed and what needs a decision. Good executive dashboard reporting reduces meeting preparation time, eliminates the 'different numbers' problem, and creates a record of decisions tied to the metrics that triggered them.

Is this different from a team-level reporting dashboard?

Yes. This page is built for leadership reviews and decision-making — the cross-functional view that executives need to align on direction, allocate resources, and assign accountability across the business. Team-level reporting dashboards are designed for department managers and operators who need to track their own KPIs in detail: campaign performance for marketing, P&L and cash for finance, throughput and cycle time for operations. An executive dashboard draws signals from all of those team views and surfaces the business-level picture — what grew, what slipped, what is at risk, and what decision each change requires. For team-level reporting, see the Marketing Teams, Finance Teams, and Operations Teams dashboards.

What should an executive dashboard include first?

Start with the essentials leaders review repeatedly: revenue and growth trend, cash and runway signals (when relevant), pipeline or demand trend, and customer health. Then add a “drivers” view so you can explain movement by segment, product, or region without opening separate reports.

What is the difference between a CEO dashboard and an executive reporting dashboard?

A CEO dashboard is usually the tightest version, a small set of outcomes and early-warning signals that support weekly leadership decisions. An executive reporting dashboard is broader, built for reviews and updates, with comparisons, context, and drilldowns that make executive dashboard reporting easy to share.

How many KPIs should be on a leadership dashboard?

Keep it lean. Most leadership dashboards work best with 8 to 15 KPIs on the first view. If you need more, place them behind drilldowns or tabs so the top level stays readable in a 10-minute review.

How do I keep an executive dashboard focused on decisions, not vanity metrics?

Tie every KPI to a decision. Add period comparisons, define what “good” looks like, and include one next-step prompt like investigate, reallocate, or escalate. If a metric doesn’t change a decision, move it out of the leadership layer.

Ready to Generate a Leadership-Ready Executive Dashboard?

Generate an executive dashboard that tracks revenue direction, pipeline health, cash signals, and customer risk in one leadership view. Spot what changed, drill into the driver, and make the next decision before the meeting ends.