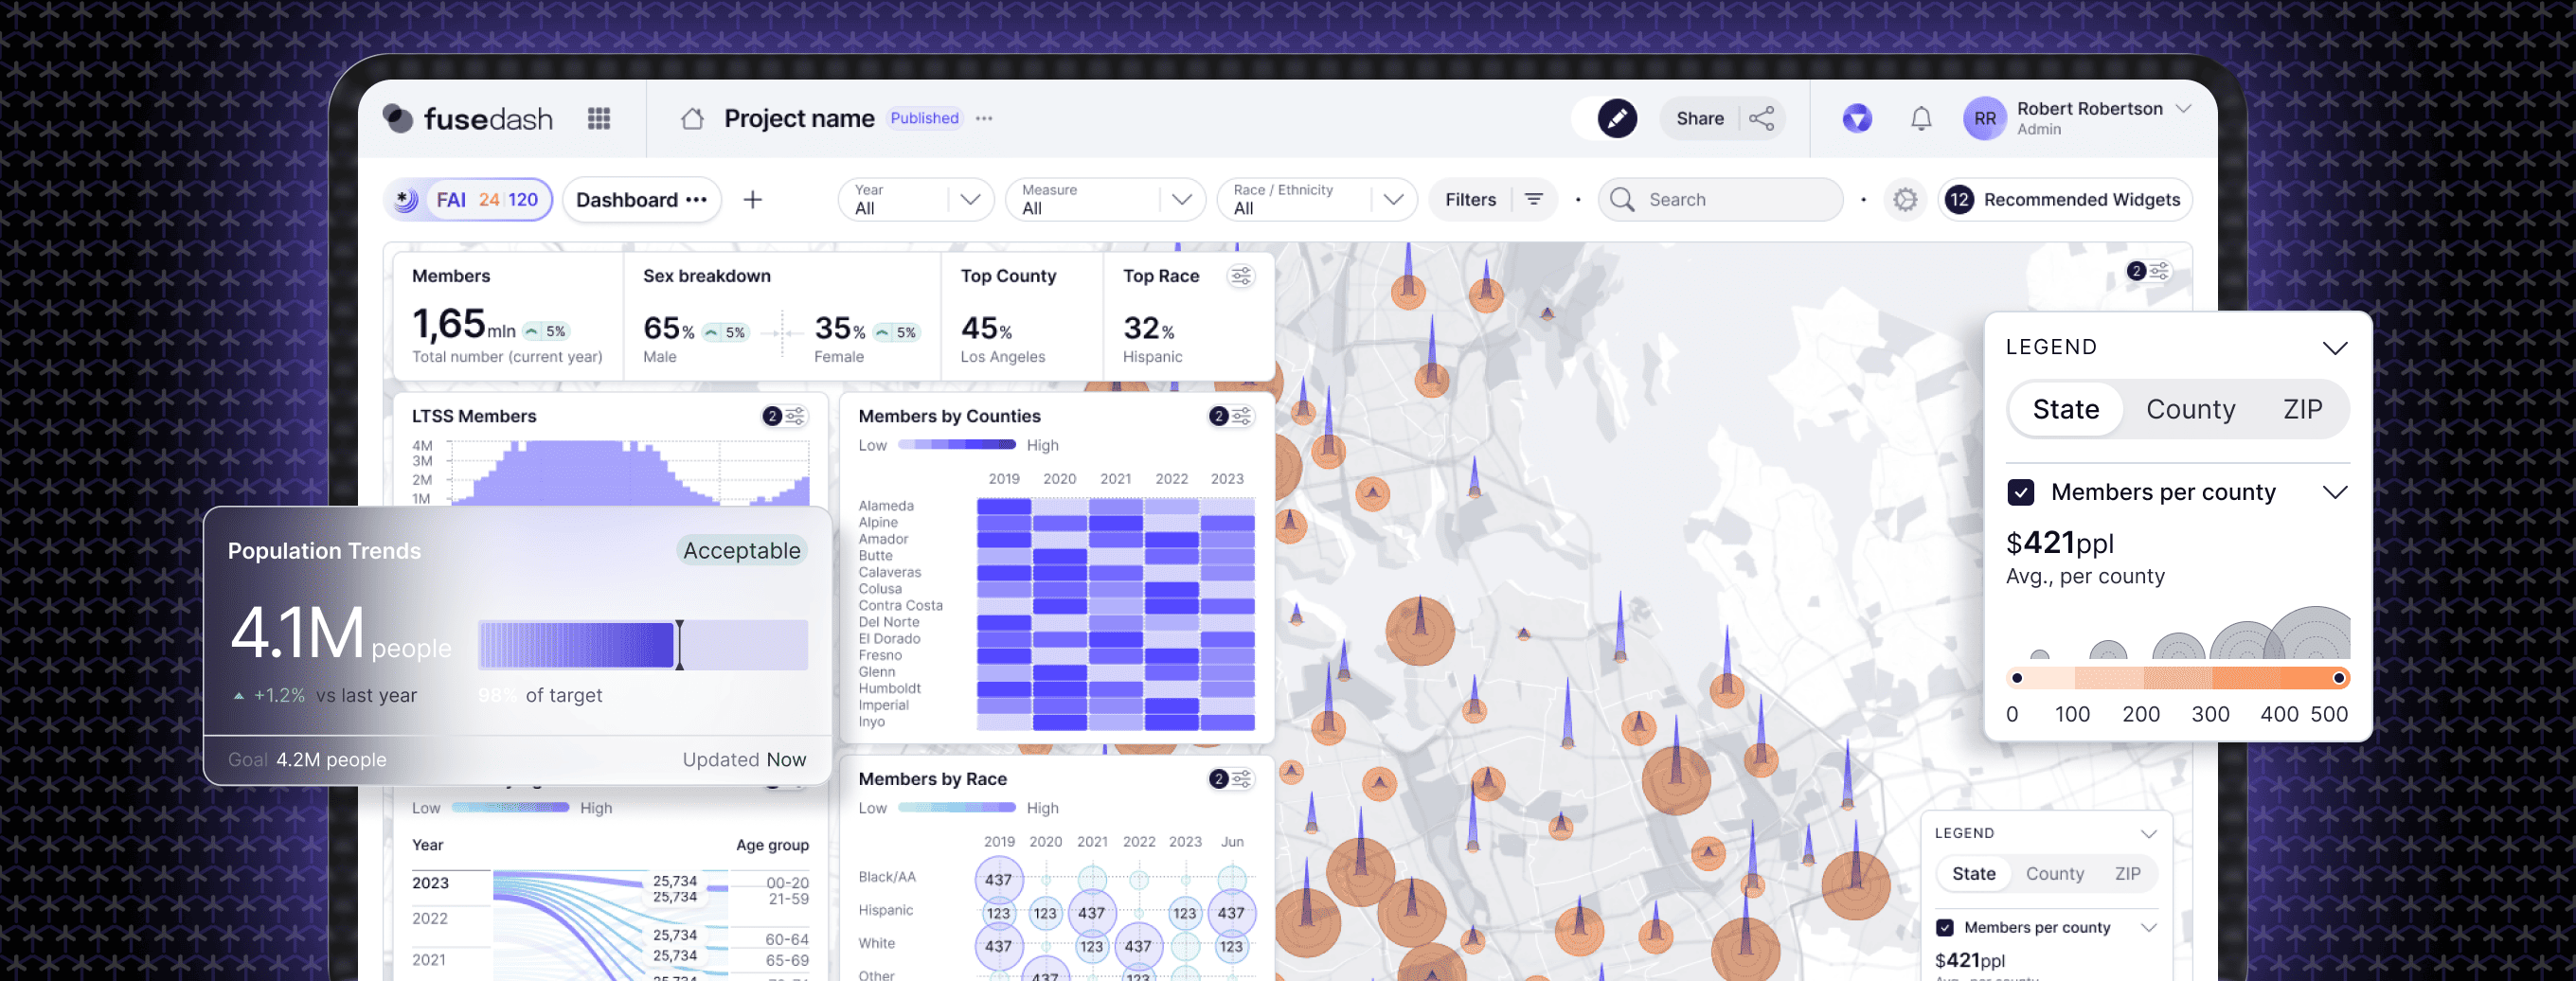
Business Intelligence Dashboards for Governed Reporting.

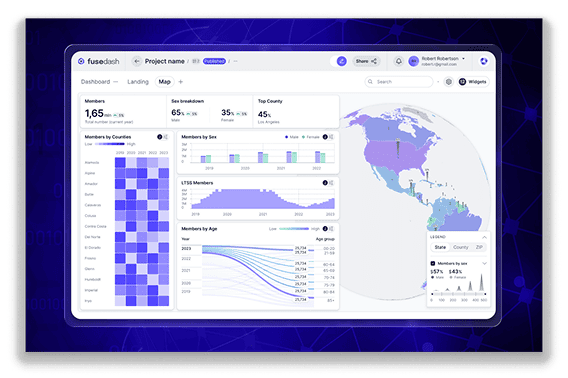
Governed BI dashboards with drilldowns, trusted definitions, and shareable views

BI teams do not struggle to create charts. They struggle to keep reporting consistent as data sources, definitions, and stakeholders multiply. Fusedash helps you build business intelligence dashboards that keep metrics governed, make exploration fast, and prevent “two versions of the truth” across teams. Use these analytics dashboards for weekly performance reviews, operational monitoring, and stakeholder reporting — with drilldowns that answer questions without rebuilding the same work every time.

fusedash/ag.drone
BI Reporting Priorities

What Business Intelligence Dashboards Must Support in Real Reporting Workflows

Strong interactive BI dashboards do two things at once: they keep metric definitions consistent, and they make investigation fast. If a dashboard cannot answer follow-up questions inside the view, stakeholders export it and rebuild their own version — creating the exact fragmentation governed reporting is designed to prevent.

Are we looking at the same definition of the KPI across teams and tools?
What changed vs the previous period, and where did the change start?
Which segment explains the movement: region, product, channel, cohort, or account?
Is the change real, or caused by freshness, missing data, or measurement drift?
Can we drill down without changing the KPI baseline or breaking the story?
Can we share the same view so decisions are made on the same numbers?
BI Dashboard Views

Business Intelligence Dashboard Views Analyst Teams Actually Use

Analysts and BI teams typically need a small set of repeatable, reusable views: one for governed metrics, one for exploration, one for operational monitoring, and one for stakeholder reporting. These four views cover the full analyst workflow — from KPI governance to executive delivery.

Insights-Driven Platform
Metric Layer

Governed KPI dashboard

A stable set of KPIs with consistent definitions, period comparisons, and a clear baseline that stakeholders can trust across departments.

Exploration

Interactive drilldown dashboard

Drill into the driver behind a change using filters and breakdowns without rebuilding reports or losing the KPI context.

Monitoring

Operational analytics dashboard

Track freshness-sensitive metrics and identify anomalies early, with views designed for ongoing monitoring rather than one-time reporting.

Stakeholder Reporting

Executive-ready BI dashboard

A clean, readable summary view with a small set of key charts and a consistent structure for recurring reviews.

Getting Started + Builder

How to Generate Business Intelligence Dashboards in Fusedash

Start with the data that drives decision-making. Focus on a small set of must-trust metrics first, then expand once the baseline is stable.

Getting Started + Builder

How to Generate Business Intelligence Dashboards in Fusedash

Start with the data that drives decision-making. Focus on a small set of must-trust metrics first, then expand once the baseline is stable.

Insights-Driven Platform
01

Connect the sources that define your core KPIs

tart with the data that drives decision-making. Focus on a small set of “must-trust” metrics first, then expand once the baseline is stable.

02

Standardize definitions before adding more visuals

Align KPI definitions across teams, including time windows, filters, attribution rules (if relevant), and how exceptions are handled, so reporting stays consistent.

03

Create comparison-first views

Add period comparisons and trend context so your BI dashboards answer “what changed” immediately.

04

Add drilldowns that match how teams investigate

Create drill paths by segment, region, product, channel, or account so stakeholders can explore without exporting data and fragmenting reporting.

Fusedash Builder

Create BI dashboards teams reuse: governed KPIs, fast drilldowns, and shareable views that keep reporting aligned across the org.

Start a free trial

The KPI Contract BI Teams Standardize First

Business intelligence dashboards win when everyone trusts the same numbers. Start with a baseline KPI layer — the KPI contract — that stays consistent across teams, then use drilldowns to explain movement without ever changing the underlying definitions.

A governed KPI baseline reused across every dashboard and report
Metric definition visibility so stakeholders know what a KPI includes
Segmentation that explains change without rewriting the calculation
Data freshness and completeness checks so the dashboard is trusted

Governed Reporting That Prevents Metric Drift

Reporting breaks when two teams answer the same question with different numbers. Business intelligence dashboards reduce debate — and eliminate metric drift — by making the definition and context visible alongside every KPI.

Shared KPI logic used across dashboards and teams
Clear scope and filtering so stakeholders interpret correctly
Stable baseline views for recurring reviews
Consistent naming and structure that prevents confusion

Drilldowns That Keep Stakeholders Out of Spreadsheets

Stakeholders export when they cannot investigate inside the dashboard. Make exploration fast so every follow-up question gets answered inside the view — without rebuilding the report or fragmenting the metric baseline.

Filters that match real questions by segment and timeframe
Breakdowns that isolate which slice caused the change
Comparisons that show when the shift started
Saved views so repeat questions take seconds, not hours

Stakeholder Reporting That Stays Consistent Month After Month

BI teams spend too much time re-formatting the same story. Generate a repeatable reporting structure that highlights what changed, keeps the narrative clear, and lets leadership share a single view rather than a screenshot deck.

A stable dashboard structure for weekly and monthly reviews
A clear “what changed” focus that drives decisions
Shareable views that reduce screenshot decks
A simple path from summary to drilldown when questions arise
FAQs Section

Business Intelligence Dashboards FAQs

Common questions from BI analysts and analytics teams building governed business intelligence dashboards, interactive BI dashboards, and self-service BI dashboards for recurring stakeholder reporting.

FAQs Section

Business Intelligence Dashboards FAQs

Common questions from BI analysts and analytics teams building governed business intelligence dashboards, interactive BI dashboards, and self-service BI dashboards for recurring stakeholder reporting.

What is a governed BI dashboard?

A governed BI dashboard is a business intelligence view where the underlying metric definitions, time windows, filters, and calculation rules are locked, documented, and reused consistently across every report and team that references them. The goal of governance is not to restrict exploration — it is to ensure that when two analysts in different departments look at the same KPI, they are looking at the same number, calculated the same way, over the same time window. A governed BI dashboard reduces metric drift, eliminates 'two versions of the truth' in leadership meetings, and creates a stable foundation for guided self-service: stakeholders can filter, drill down, and explore segment breakdowns within the governed view without ever changing the baseline calculation.

What is metric drift in BI reporting?

Metric drift in BI reporting is the gradual divergence of a KPI's definition or value across teams, tools, or time periods — usually caused by incremental changes to filters, time windows, attribution rules, or data source logic that are not communicated or documented across the organisation. It typically starts small: one team adjusts a filter to exclude a specific data segment, another team adds a new data source, a third team changes the attribution window for a campaign metric. Over months, the same KPI name produces different numbers in different reports, and leadership meetings stall on 'which number is right' rather than on what to do about it. Governed BI dashboards prevent metric drift by locking definitions at the source and reusing the same calculation everywhere.

What is the difference between a BI dashboard and a BI report?

A BI dashboard is a live, interactive view of key metrics that updates on a schedule or in real time — designed for monitoring, exploration, and recurring reviews where stakeholders need to see direction and drill into drivers quickly. A BI report is a static or periodically generated document that compiles data into a structured narrative for distribution — designed for audit, compliance, or scheduled communication where stakeholders need detail and record rather than exploration. In governed BI reporting, dashboards and reports work together: the dashboard provides the stable, trusted baseline that multiple teams can explore, while the report provides the interpretation and context that stakeholders need to act. The key governance advantage of dashboards over reports is consistency — a well-governed BI dashboard shows the same number to every stakeholder, every time, with no manual compilation step that can introduce variation.

What is a certified dashboard and when should we use one?

A certified dashboard is a trusted, approved view that stakeholders use for official reporting. Use certification for leadership reviews, recurring metrics, and KPI scorecards where teams need one source of truth and changes should be controlled.

Can BI dashboards be self-service without breaking governance?

Yes. The best model is guided self-service: stakeholders can filter, drill down, and explore approved segments, while the underlying metric definitions remain governed. This gives teams flexibility without creating inconsistent dashboards across departments.

How do we show data freshness and trust in a BI dashboard?

Add trust signals directly in the view: last refresh time, coverage or completeness notes, and clear definitions for core KPIs. This reduces “is this data current” questions and keeps decision-making moving.

Ready to Generate Governed Business Intelligence Dashboards?

Generate business intelligence dashboards with governed KPI definitions, drilldowns that answer follow-up questions without exports, and shareable views your organisation can rely on — without creating two versions of the truth.