
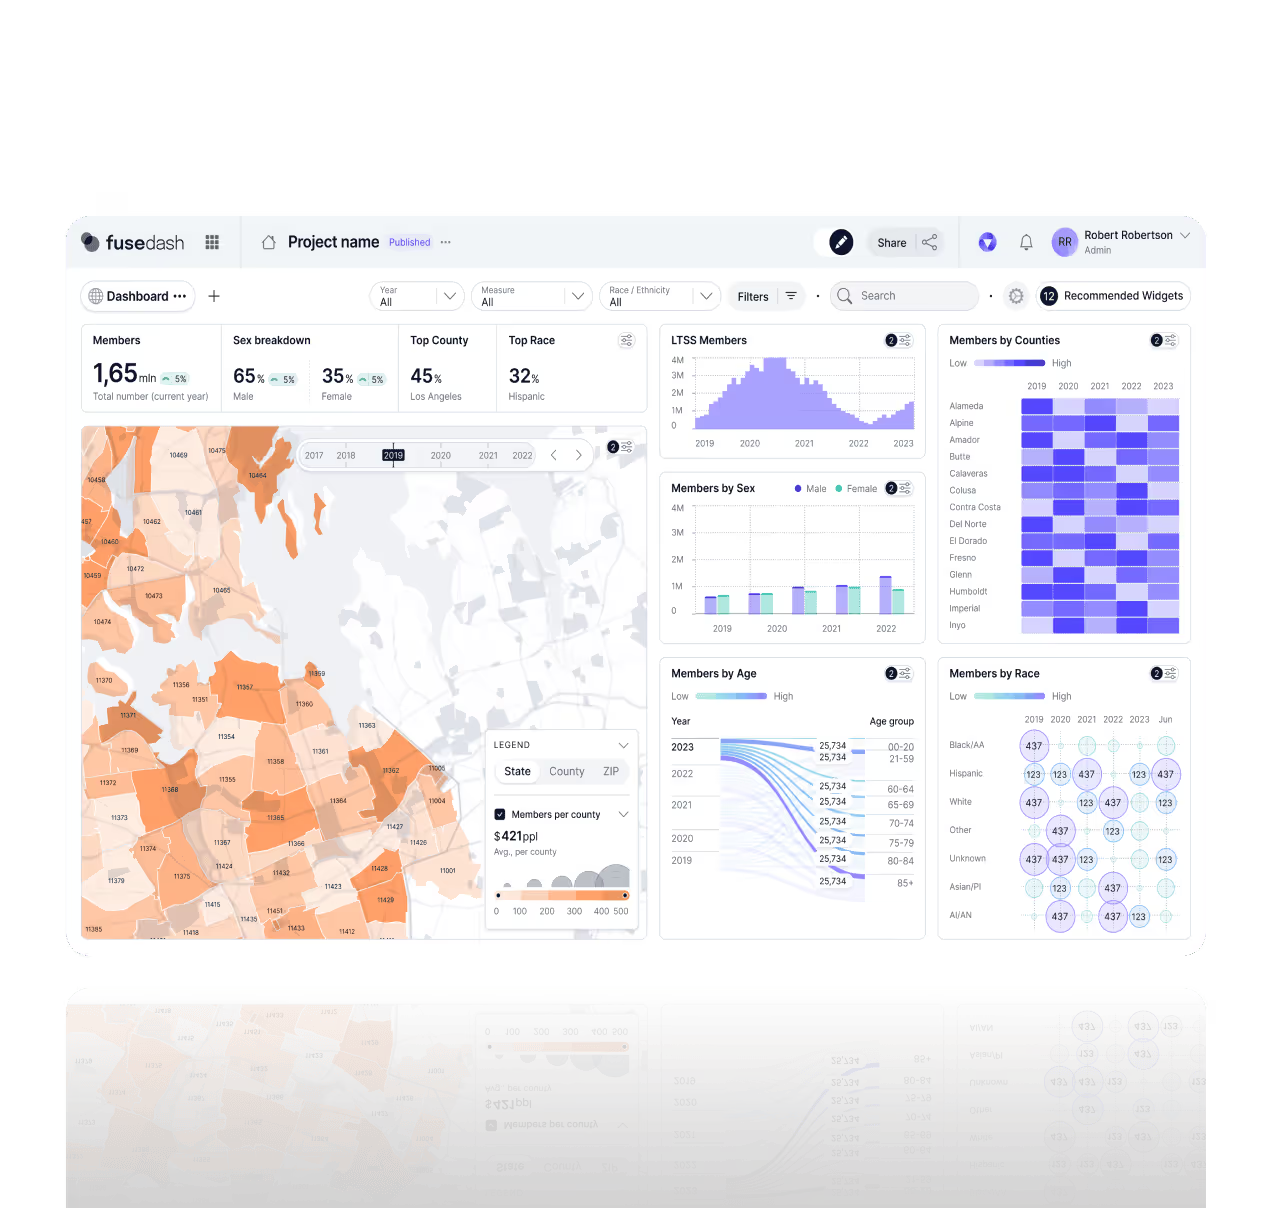

Dashboard Software for KPI Tracking and Business Reporting
Fusedash is dashboard software that helps teams turn their raw data into clear, interactive KPI dashboards. Build business intelligence dashboards, explore trends, and monitor performance in real time from a single workspace. The no-code dashboard builder feels simple from the first click — no technical setup, no engineering support needed.
Create dashboards for all your needs, such as marketing, operations, product analytics and many, many mor. Use filters and drill-down to explore segments, compare time periods, and answer questions fast without writing code.
What You Can Build With Fusedash Dashboard Software & Your Data
Fusedash dashboard software lets you build KPI views for daily tracking, weekly reporting, and leadership updates. Combine KPI cards, charts, tables, and comparisons in one interactive dashboard, then use filters and drilldowns to spot trends, isolate segments, and understand what changed.
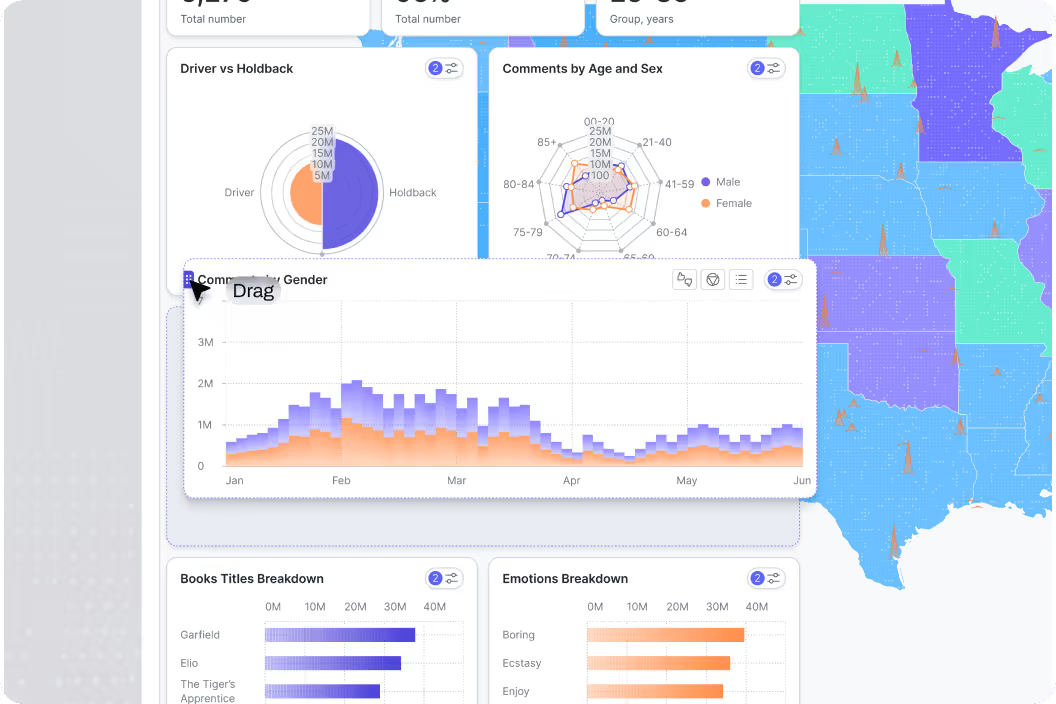
100% Customizable Dashboard Layouts
Organize your dashboard software layout around the KPIs and workflows that matter most. Choose a structure, group metrics by topic, and add enough context so anyone can gain insight quickly. Share the same layout across teams to keep decisions aligned and reporting consistent.
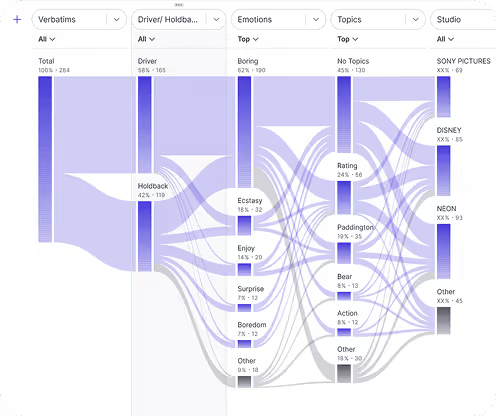
Interactive Dashboard UI
Explore your data in a live, interactive dashboard UI. Filter by segment, drill down into details, compare time periods, and switch views without rebuilding reports. Fusdash interactive dashboard software is designed for follow-up questions so your team moves from overview to root cause in a few clicks. For deeper visual exploration, pair dashboards with interactive charts.
How Teams use Dashboard Software
Teams use dashboard software differently depending on what they need to monitor and how often they review it. Fusedash is built to handle daily KPI tracking, weekly performance reviews, and executive reporting from the same workspace. Connect your data once and build the interactive dashboards each team actually needs without rebuilding logic from scratch.
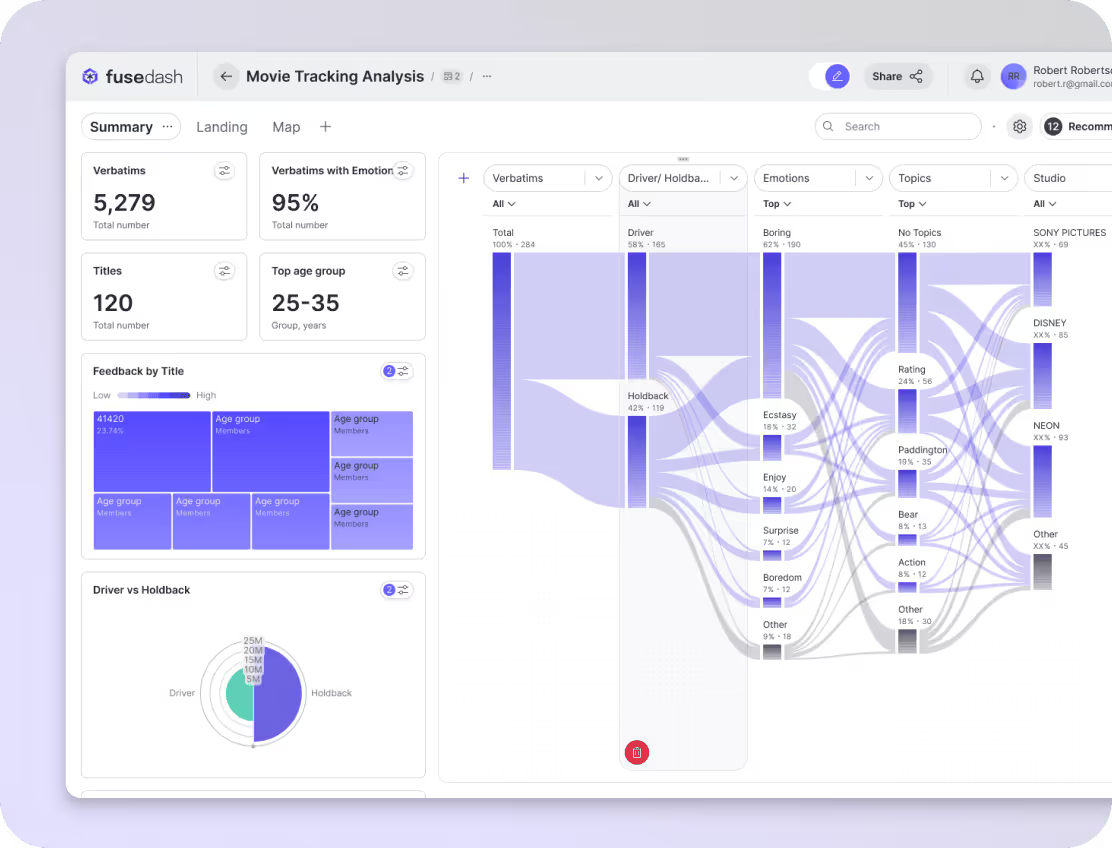
Analytics and KPI monitoring
Build interactive dashboards around your core KPIs, then track trends over time and break results down by team, product, region, or channel. When numbers move, you quickly see what has changed and where to focus next. See dashboard examples for proven KPI structures.
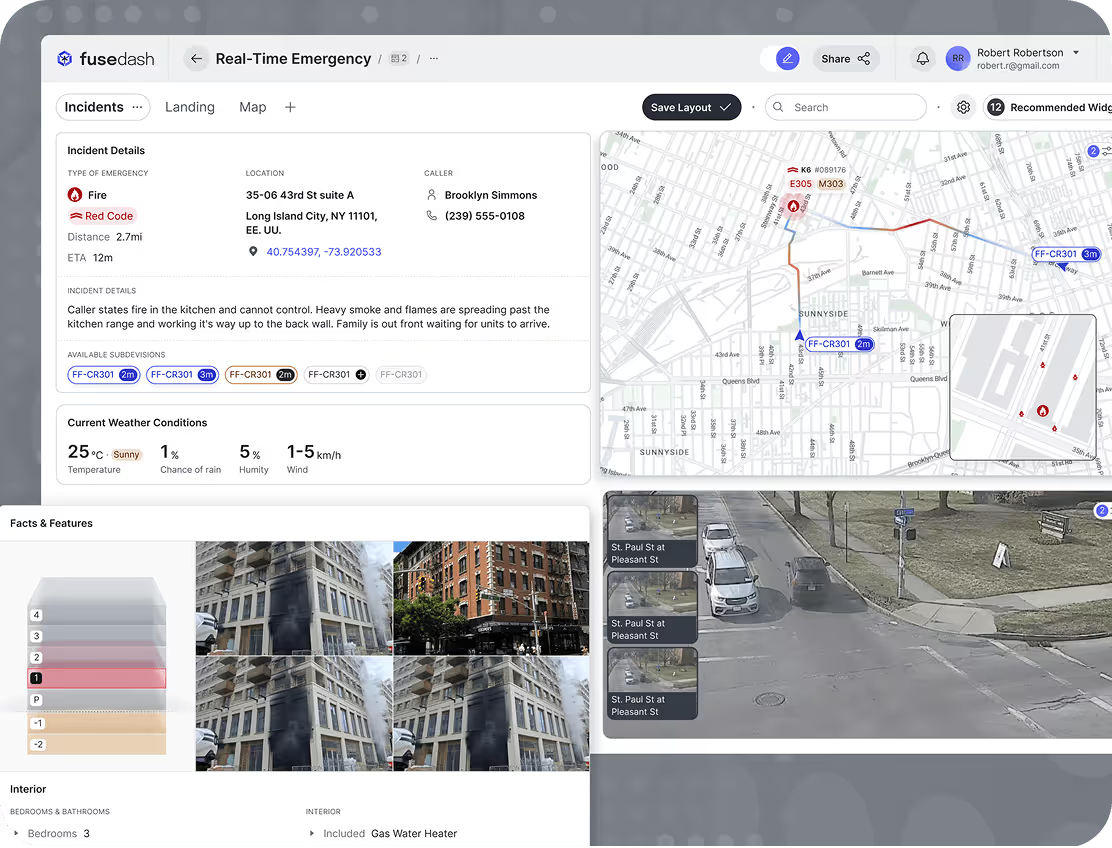
Real-time Monitoring and Alerts
Keep live KPIs visible to monitor real-time performance. Auto-refresh dashboard software keeps metrics current, tracks spikes and drops, and lets teams filter by segment to isolate the driver before results become unrecoverable. See how live monitoring works in our Real-Time Interface.
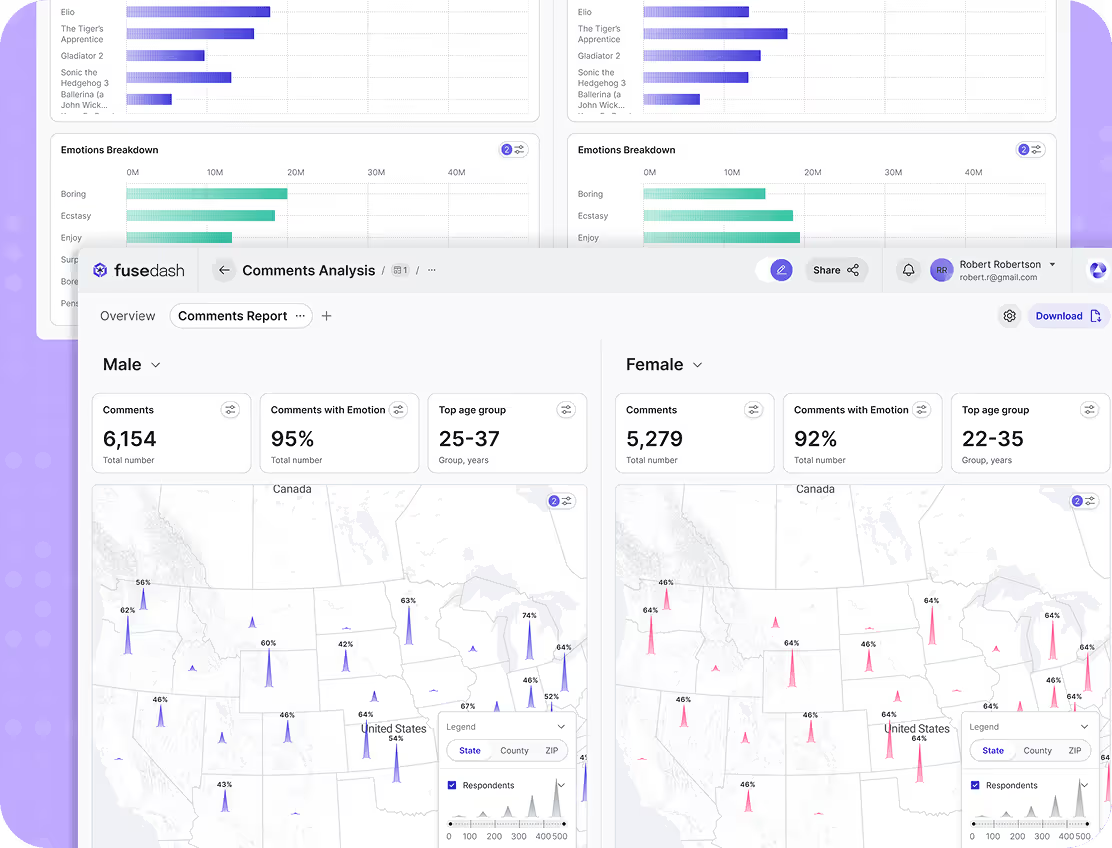
Interactive Dashboard Exploration
Turn dashboards into a workspace, not a static report. Filter and drill down to answer follow-up questions fast, or tap into AI chat to discover more. For leadership reporting and multi-audience communications, use data storytelling to explain what the data is saying with simple data visualizations and your personalized content inputs.
How to Build Interactive Dashboard Software in Fusedash
Building dashboard software in Fusedash is straightforward. Connect your data, choose a layout, and use dashboard tools like widgets and filters to create an interactive dashboard your team can actually use. Start simple with a few KPIs, then add drill-downs and comparisons to display changes with simplicity and clarity.
Fusedash is online dashboard software designed for speed and clarity. Once your data is connected, add KPI cards, charts, tables, and maps, then explore results through an interactive dashboard UI with filters, drill-downs, and AI chat for guidance. Share one clean view so every team member uses the same metrics and definitions.


Connect Your Data
Connect CSV files, spreadsheets, or APIs to power your dashboards. Use refresh rules to keep metrics up to date so your dashboard stays reliable for daily decisions.

Choose a dashboard layout
Start from a clean layout and organize KPIs by section. Build business intelligence dashboards that are easy to scan, easy to navigate, and easy to present.

Add & Configure Widgets
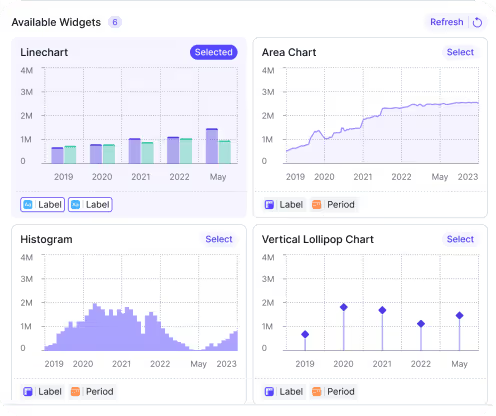
Use dashboard tools like charts, KPI cards, tables, and maps to build the view. Configure each widget with the metric, breakdown, and time range that matters for your workflow.

Apply Filters & Drill-Downs
Explore performance with filters, segments, and drill-downs. Compare groups, change time periods, and isolate drivers without rebuilding reports. Have mid-project questions, ask our AI chat for guidance whenever needed.

Use AI to explore faster
Use the AI dashboard generator to build charts instantly, surface unusual metric changes, and spot trends before your next review. Ask our AI questions about your KPIs in plain language and get answers with charts and context so your team always knows what changed and why.

Share & Collaborate
Share dashboards with stakeholders using one link and consistent views. Keep teams aligned with the same dashboard definitions, and reduce the back-and-forth of screenshots and manual reporting.
Interactive Dashboard Examples Built with Fusedash
Explore real dashboard examples built with Fusedash dashboard software. These interactive business intelligence dashboards show how teams across finance, marketing, and operations track KPIs, spot trends, and monitor performance in real time.
Use these examples to see how different teams structure their dashboard layouts, which KPIs they track, and how interactive filters and drilldowns help answer questions faster.

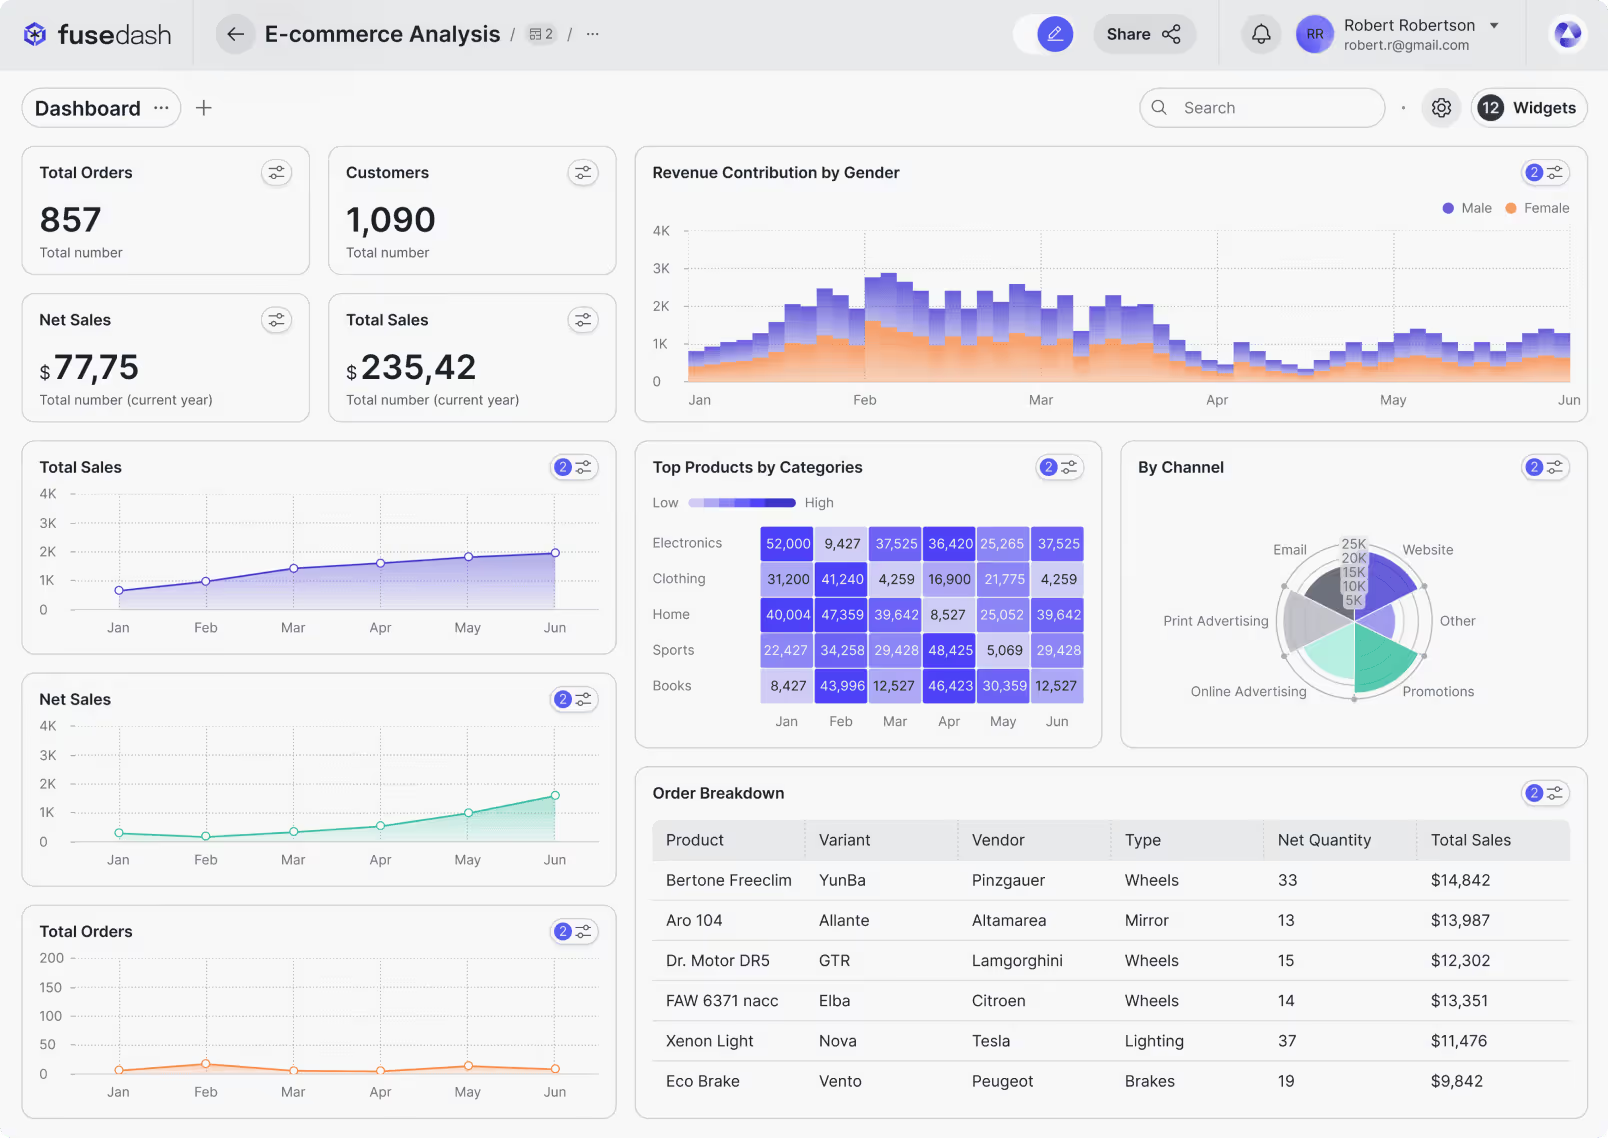
E-commerce
Track store performance with an interactive e-commerce dashboard. Monitor revenue, orders, conversion rate, and top products, then use dashboard tools like charts and KPI cards to filter by channel, category, or timeframe and spot seasonality.
Marketing Teams
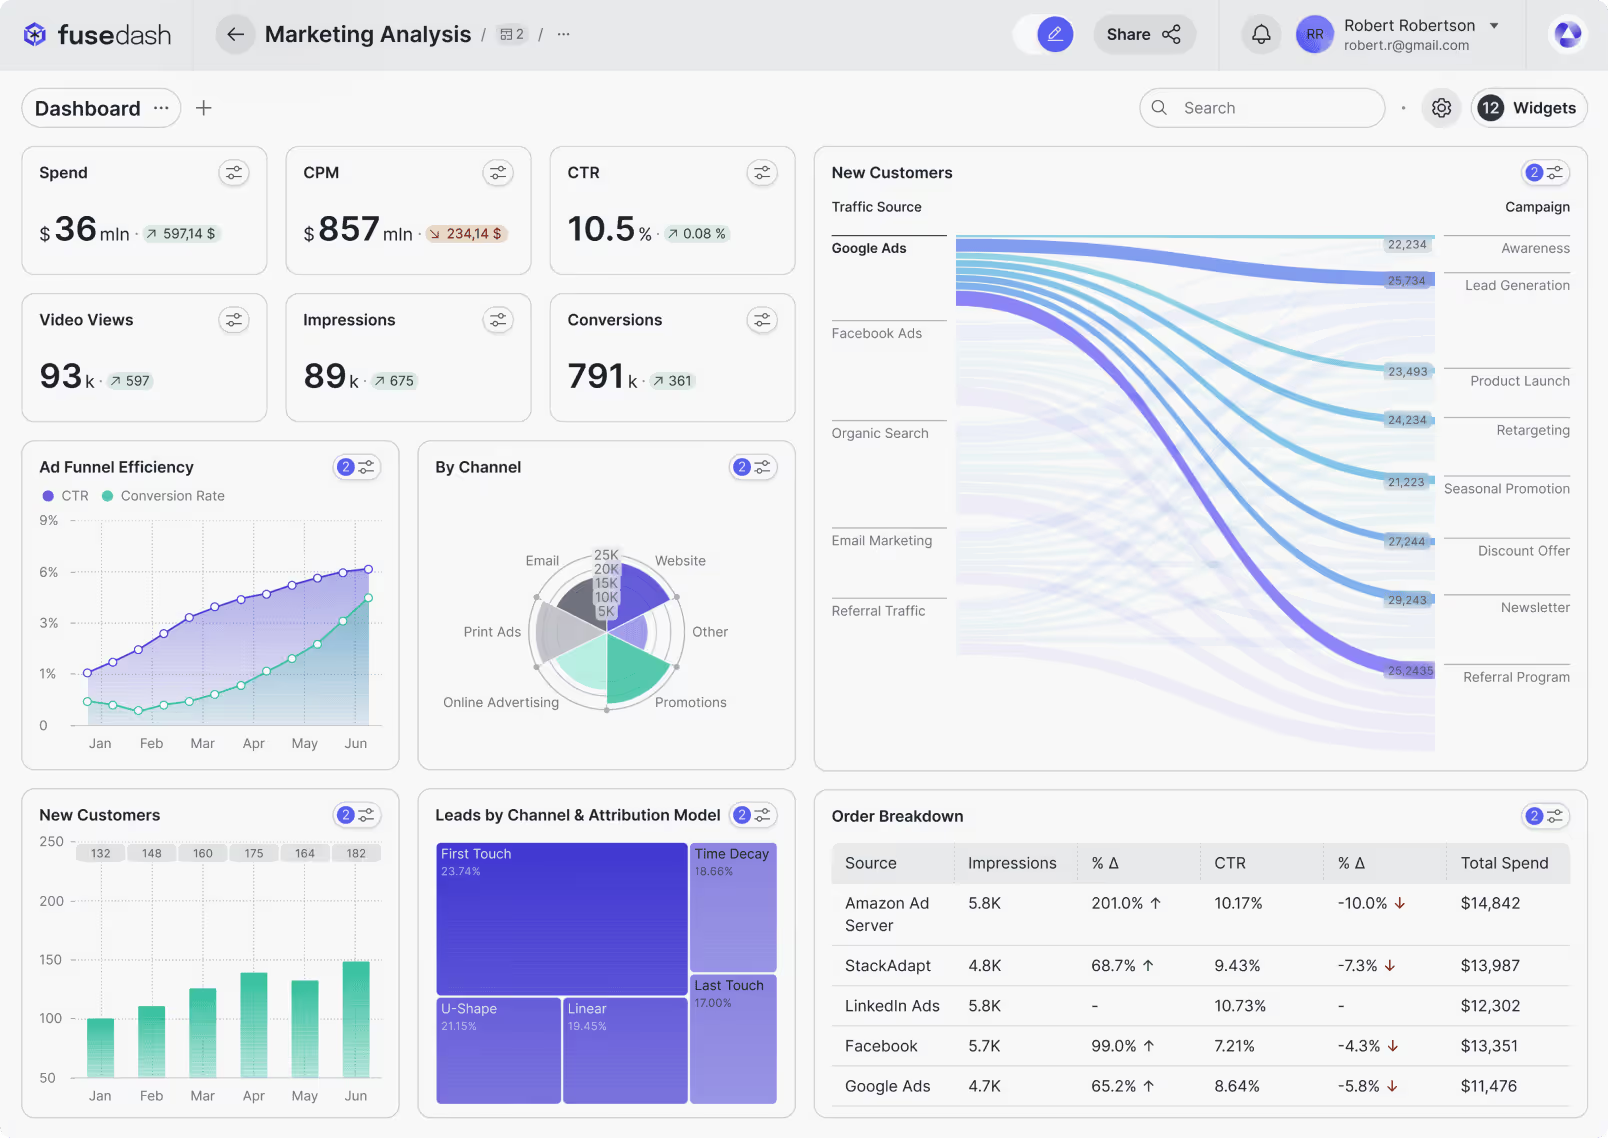
See what is working across campaigns with Fusedash dashboard software. Track spend, ROAS, conversions, and CAC, then drill down by platform, campaign, or date range in a marketing team dashboard to improve performance faster.
Finance
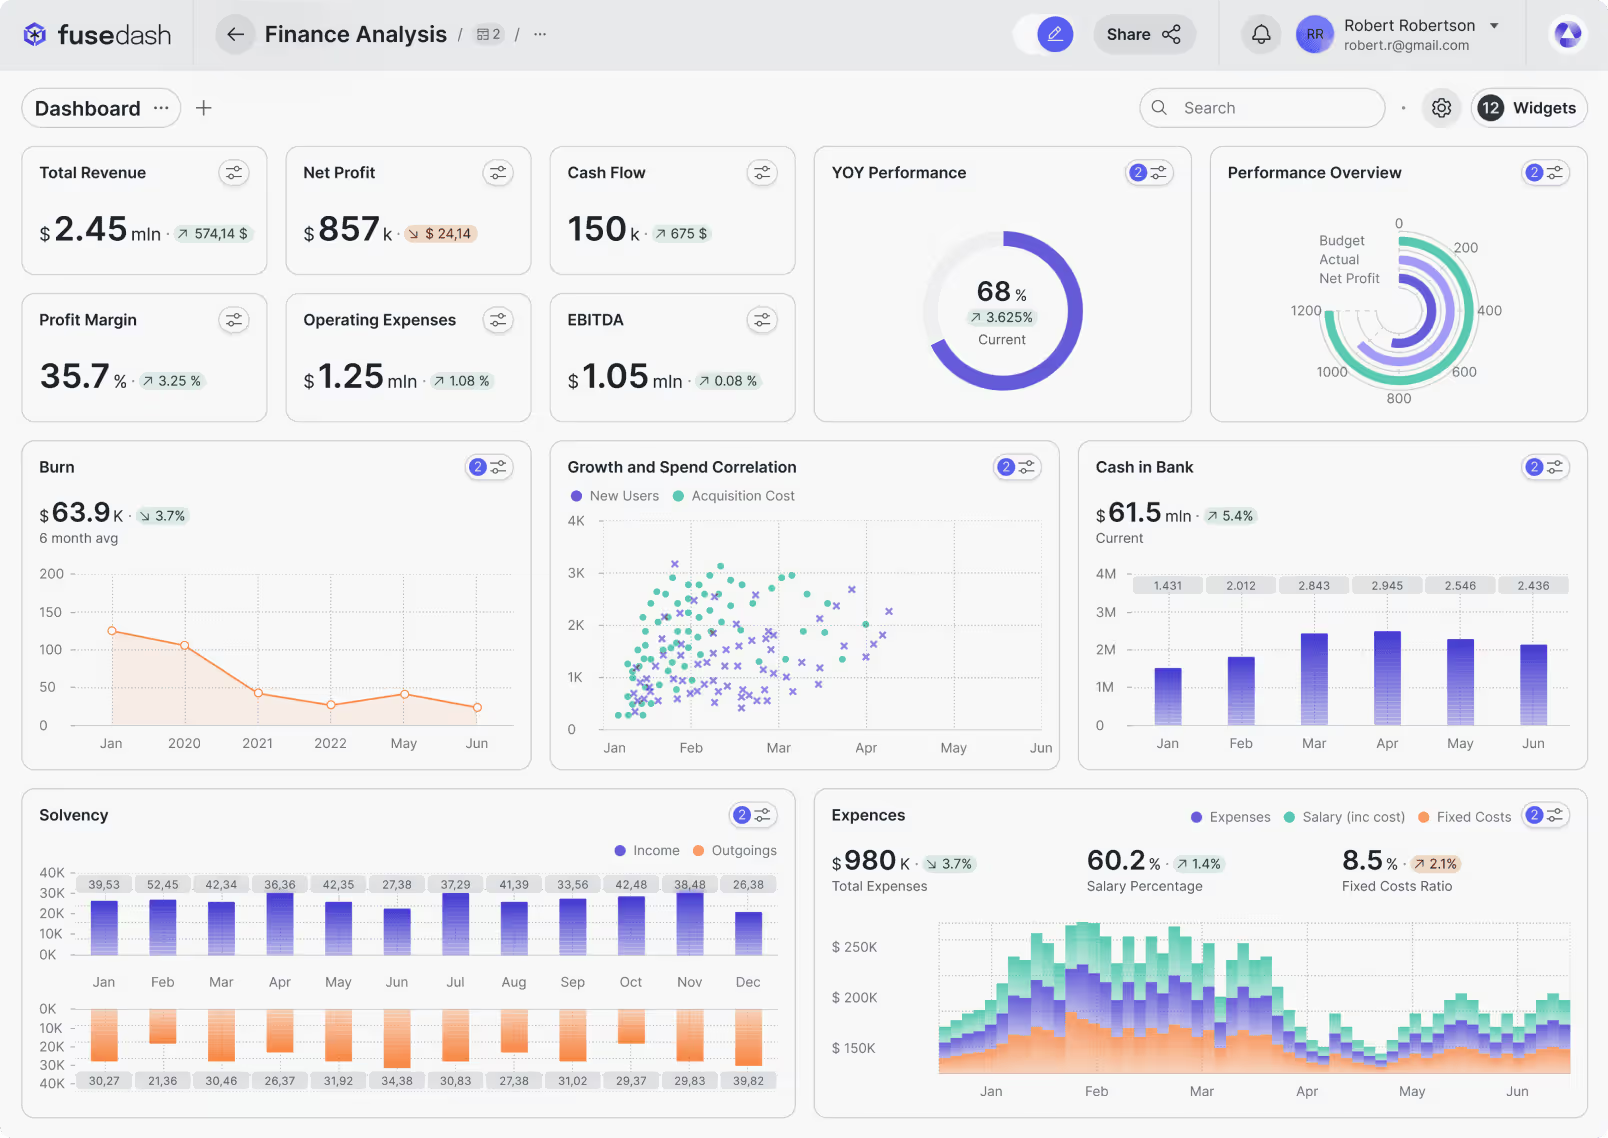
Make financial reporting easier with a finance dashboard that tracks cash flow, revenue, expenses, margin, and forecast variance. Use the dashboard software interface to compare periods, drill into departments or accounts, and share a clear view of financial performance with stakeholders.
Dashboard software FAQs
Have questions about Fusedash dashboard software? Learn how interactive business intelligence dashboards work, what data you can connect, and how teams use the dashboard builder to explore KPIs, track performance, and share insights across the business.
What is dashboard software?
Dashboard software is a platform that connects to your data sources and turns raw numbers into visual views your team can monitor, explore, and share. It brings key metrics into one place, keeps definitions consistent across teams, and makes it possible to answer follow-up questions without rebuilding a report from scratch. The best dashboard software supports multiple view types from the same dataset: daily KPI tracking for operations teams, weekly performance reviews for managers, and executive summaries for leadership. When structured around a fixed set of performance indicators reviewed on a consistent cadence, a dashboard built in dashboard software becomes the operating rhythm for the team that owns it. When it also generates layouts and chart suggestions from your data automatically, it is called an AI dashboard generator, which is what Fusdash offers.
What is an interactive dashboard?
Interactive dashboard software lets your team filter, drill down, and explore data without rebuilding reports. Unlike static dashboards, interactive dashboard software responds to clicks and selections in real time so follow-up questions get answered in seconds.
Turn your data into dashboards
Start a free trial or request a demo to see Fusedash in action.