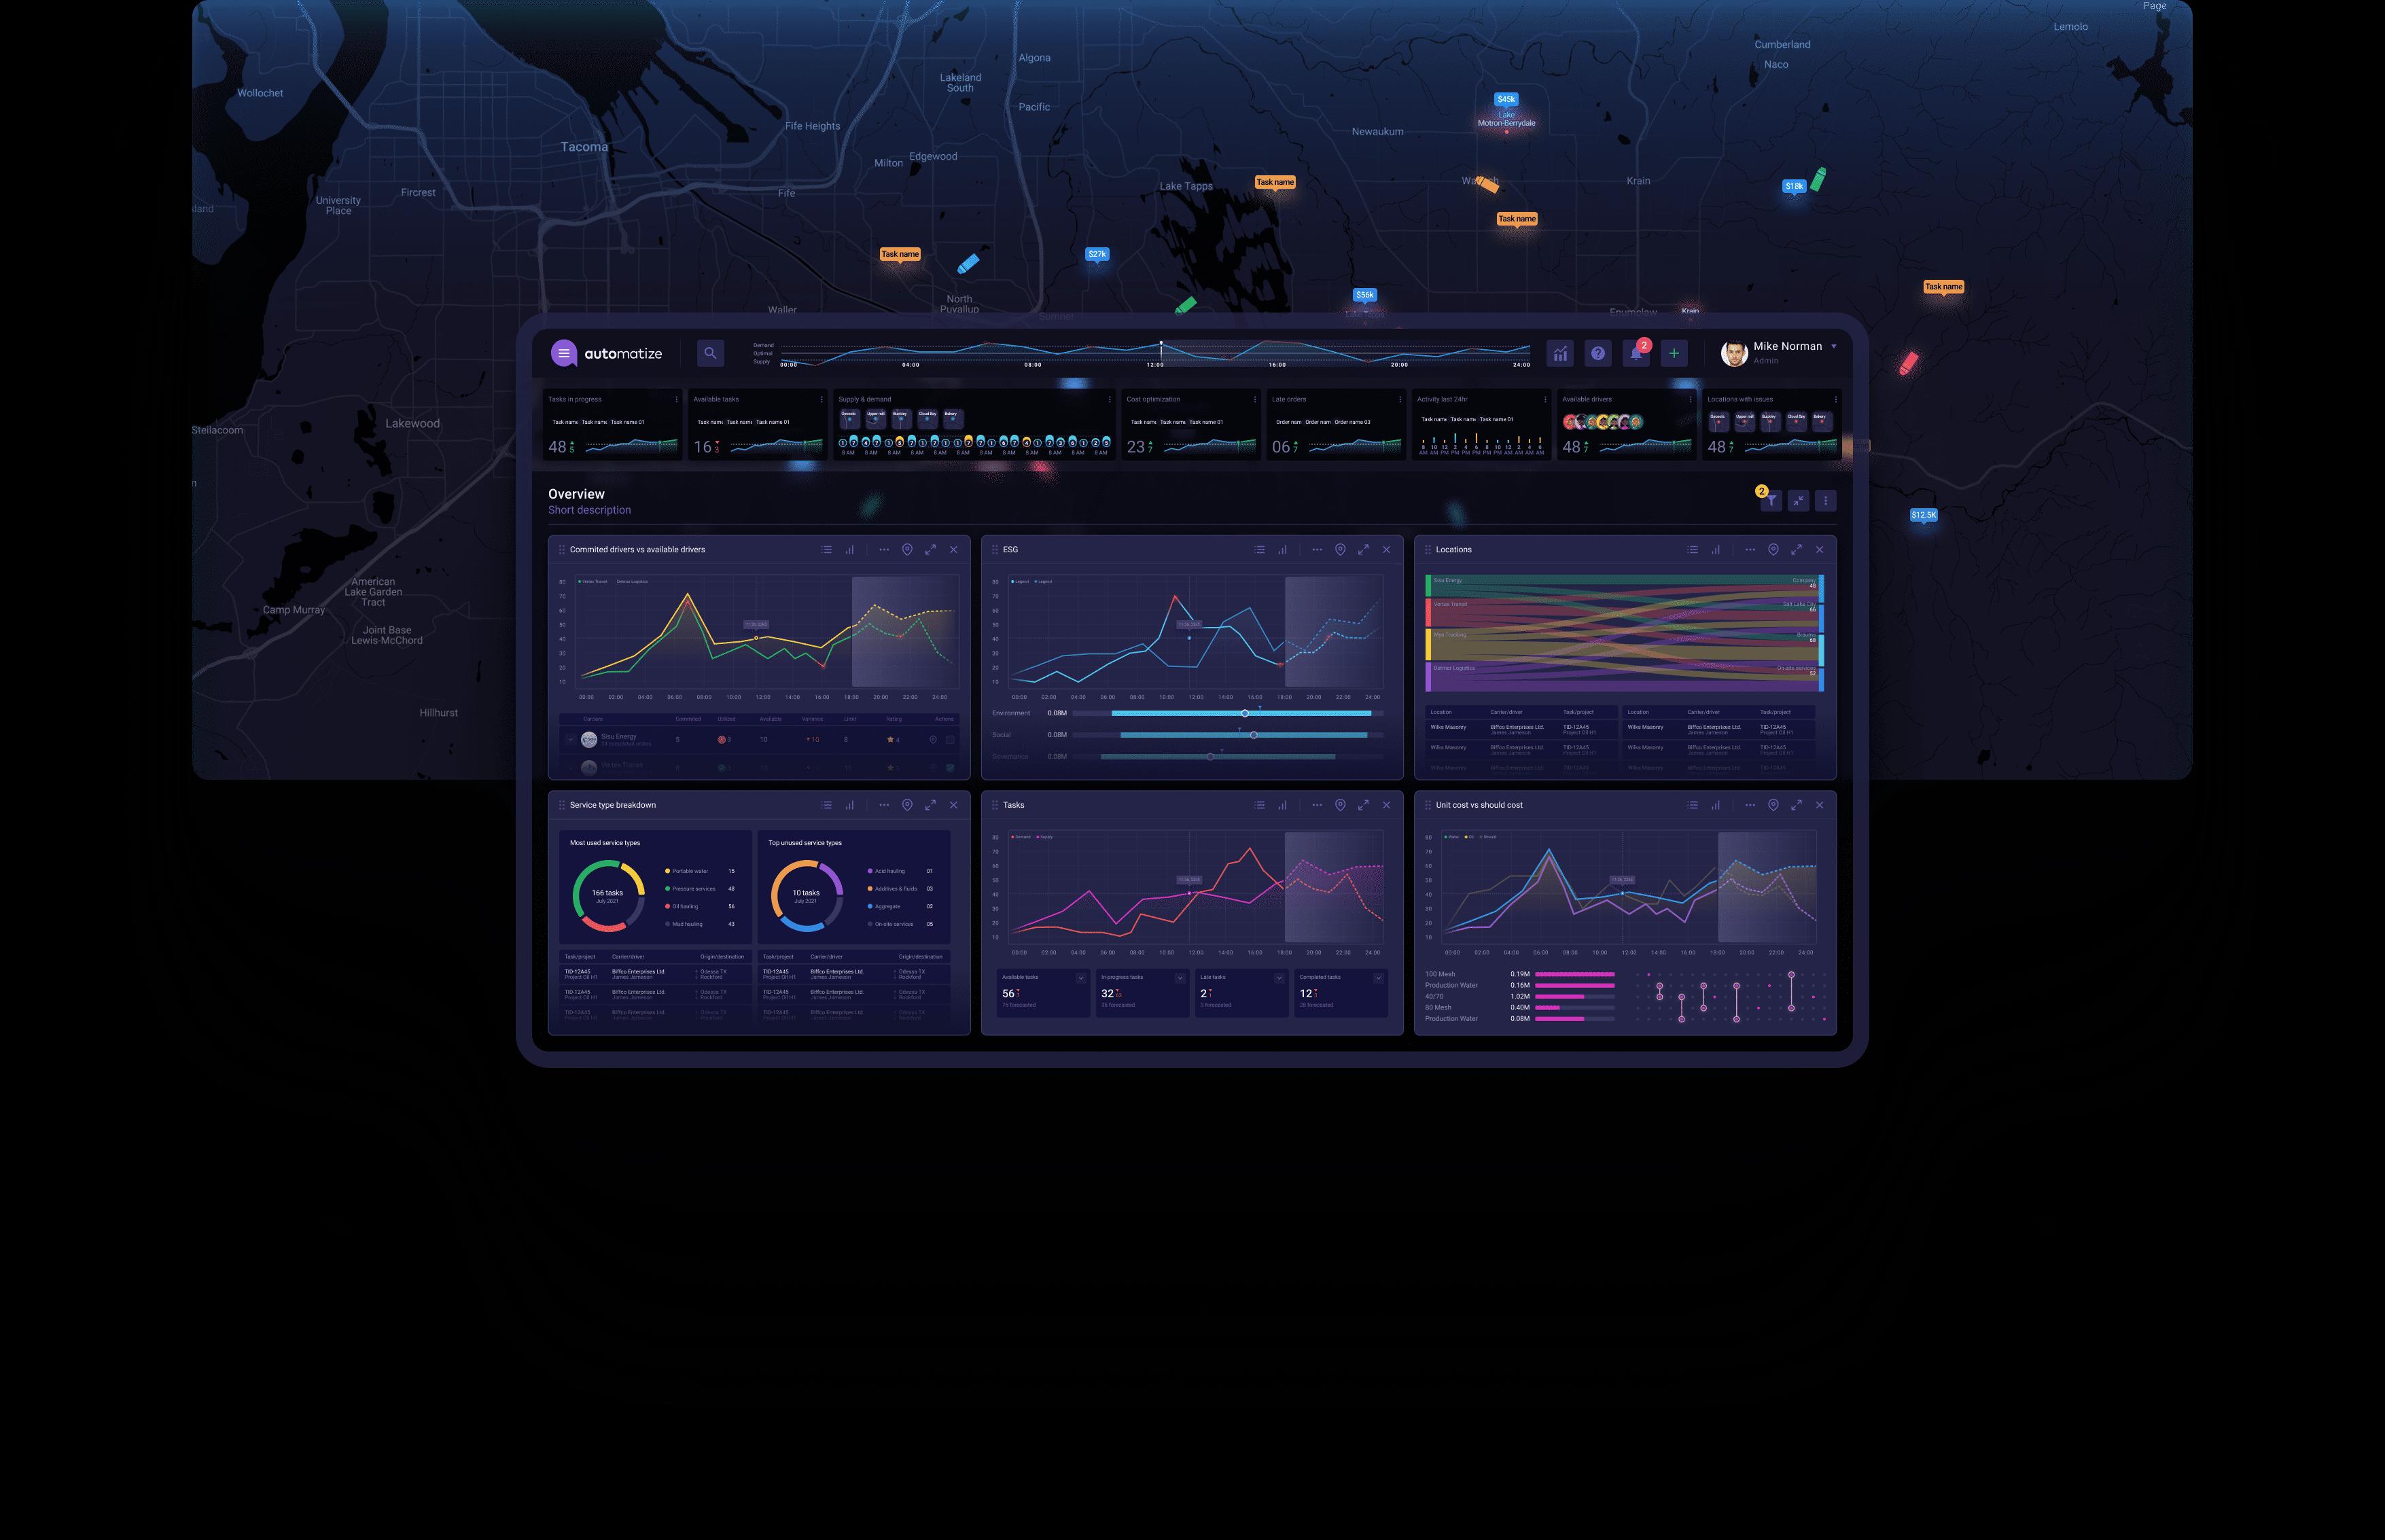
Logistics Dashboard

Track fulfillment, inventory, delivery performance, and SLA risk in one view Start with our dashboard software.

In logistics, problems rarely appear everywhere at once. A single warehouse gets backed up, one carrier slips on a lane, or inventory gaps create a cascade of late orders. Fusedash helps you build a logistics dashboard that surfaces bottlenecks early and shows exactly where to act, so teams spend less time hunting and more time recovering performance.

Use it as a fulfillment dashboard for throughput and backlog, an inventory dashboard for stock position and stockout risk, and a delivery performance dashboard for on-time rates across carriers, routes, and regions. Together, it becomes an operations and logistics dashboard your team can run daily. Start with our dashboard software. Add maps for regional visibility. Use real-time monitoring when SLAs can slip quickly.

fusedash/ag.drone
Daily operating questions

What your logistics dashboard should answer every shift

A strong supply chain dashboard reduces time-to-diagnosis. It should show where work is stuck, what is at risk, and what lever will recover SLAs fastest.

Daily operating questions

What your logistics dashboard should answer every shift

A strong supply chain dashboard reduces time-to-diagnosis. It should show where work is stuck, what is at risk, and what lever will recover SLAs fastest.

Which orders are at risk today, and what is blocking them?
Where is cycle time rising: pick, pack, staging, carrier handoff, or transit?
Which warehouse, lane, or carrier is drifting versus last week’s baseline?
Are we meeting SLA targets by service level and region?
Where is inventory becoming a constraint: low cover, stockouts, or slow movers?
What should we do next: rebalance labor, reroute shipments, or expedite replenishment?
Dashboard views

The dashboard views logistics teams actually use

Logistics teams need clear views for flow, inventory risk, carrier performance, and SLA exceptions. These four dashboards cover the daily reality without turning into noise.

Dashboard views

The dashboard views logistics teams actually use

Logistics teams need clear views for flow, inventory risk, carrier performance, and SLA exceptions. These four dashboards cover the daily reality without turning into noise.

Insights-Driven Platform
Warehouse Flow

Fulfillment dashboard (throughput and backlog)

Track order volume, backlog, and cycle time by shift so supervisors see where work is building and which station needs attention.

Inventory Risk

Inventory dashboard (stock position and cover)

Monitor stock levels, days of cover, and stockout risk by SKU, category, and warehouse to prevent fulfillment delays before they start.

Carrier Performance

Delivery performance dashboard (routes and delays)

Compare carriers and lanes by on-time rate, transit time, and delay reasons so teams can reroute volume and protect SLA outcomes.

Exception Control

SLA dashboard (at-risk orders)

A live view of at-risk orders ranked by SLA deadline, with drill-downs that show where they are stuck and what action will recover them.

Getting Started

How to build an operations and logistics dashboard in Fusedash

Build the first version around exceptions. When you can find at-risk orders and the bottleneck fast, the dashboard becomes operational, not decorative.

Getting Started

How to build an operations and logistics dashboard in Fusedash

Build the first version around exceptions. When you can find at-risk orders and the bottleneck fast, the dashboard becomes operational, not decorative.

Insights-Driven Platform
01

Connect order, warehouse, and shipment data

Import CSVs or connect APIs for orders, scan events, inventory, shipments, and carrier tracking so your dashboard reflects the real workflow.

02

Define SLA rules and exception thresholds

Set SLA targets by service level and region, then define thresholds for backlog, cycle time, late scans, and low inventory cover.

03

Build one command view, then drill-down views

Create one overview for standups, then drill into warehouse, carrier, lane, SKU, and region views without rebuilding reports.

04

Add filters that match ownership

Filters for warehouse, carrier, lane, service level, region, and timeframe make it easy to route issues to the right team fast.

Fusedash Builder

Build logistics dashboards teams use daily: consistent SLA definitions, fast drill-downs, and shareable views for ops and support.

Start a free trial

Logistics KPIs to track first

A logistics dashboard becomes actionable when it ties flow, inventory, and delivery outcomes into one set of signals. Start with these KPIs, then break them down by warehouse, carrier, lane, and region to spot drift early.

Order cycle time, backlog volume, and throughput by shift
Stockout risk, days of cover, and aging inventory signals
On-time delivery rate, transit time, and delay reasons
SLA hit rate by service level, region, carrier, and lane

SLA exception management without spreadsheet chaos

Most SLA misses are recoverable early, but only if the right orders surface in time. Use an SLA dashboard to prioritize exceptions and make the next action obvious.

At-risk orders ranked by SLA deadline and impact
Exceptions grouped by cause (warehouse, inventory, carrier, address)
Recovery actions tied to the right owner and team
Shared visibility with customer support for consistent updates

Carrier and lane performance you can act on

A delivery performance dashboard should reveal where drift started and what changed. Compare carriers and lanes using the same time windows so decisions are based on signal, not anecdotes.

Lane comparisons for on-time rate and transit time
Delay reasons that explain performance drops by route
Scan gaps that hide problems until it’s too late
Filters by region and service level to isolate the driver

Real-time visibility during peaks and disruptions

During high volume periods, manual refresh is too slow. Real-time monitoring helps teams catch bottlenecks as they form and recover SLAs while impact is still containable.

Backlog spikes and throughput drops during surges
Inventory risk increasing on high-velocity SKUs
Carrier anomalies on critical lanes and regions
SLA at-risk volume rising by service level
FAQs Section

Logistics dashboard FAQs

Common questions teams ask when building a logistics dashboard for fulfillment, inventory, delivery performance, and SLA monitoring.

FAQs Section

Logistics dashboard FAQs

Common questions teams ask when building a logistics dashboard for fulfillment, inventory, delivery performance, and SLA monitoring.

What is a logistics dashboard?

A logistics dashboard is a single view of fulfillment and delivery performance. It brings inventory signals, warehouse throughput, carrier performance, and SLA tracking into one place so teams can spot delays early and act before issues compound.

What is a supply chain dashboard vs a logistics dashboard?

A supply chain dashboard is broader and may include procurement, suppliers, production, and planning. A logistics dashboard focuses on execution: fulfillment, inventory availability, delivery performance, and SLAs across warehouses, carriers, routes, and regions.

Which KPIs should I include first?

Start with cycle time, backlog, throughput, stockout risk, on-time delivery rate, transit time, and SLA hit rate. Then break down by warehouse, carrier, lane, region, and service level.

Can I filter by warehouse, carrier, route, or region?

Yes. Filters and drilldowns help you isolate where performance changed, for example one warehouse falling behind, one carrier trending late, or one region seeing higher delivery exceptions.

Can this dashboard update in real time?

Yes. Real-time monitoring helps during peak periods when backlog and delivery performance can shift quickly. For live monitoring, see Real-Time Interface.

Can customer support use the SLA dashboard?

Yes. A shared SLA dashboard helps support teams set expectations, prioritize escalations, and communicate accurate ETAs based on live fulfillment and delivery signals.

What systems can I connect (WMS, TMS, carrier data) to build this dashboard?

Start from exports like CSV, then connect sources and APIs as needed. Common inputs include WMS events, TMS route and dispatch data, carrier tracking updates, order and shipment status, and inventory snapshots.

Is this different from an operations dashboard for internal throughput and cycle time?

Yes. This page is for logistics visibility across fulfillment, inventory, delivery performance, and SLAs. If you need a broader internal operations KPI view (throughput, cycle time, bottlenecks, productivity), start with dashboard software and build an operations KPI view there.

Ready to build a decision-ready logistics dashboard?

Track fulfillment, inventory, delivery performance, and SLA risk in one view. Detect bottlenecks early, drill into the driver, and share a source of truth across ops and support.