Marketing Dashboard for CAC, ROAS, and Budget Pacing.

Track CAC, ROAS, pipeline impact, and channel mix in one marketing dashboard

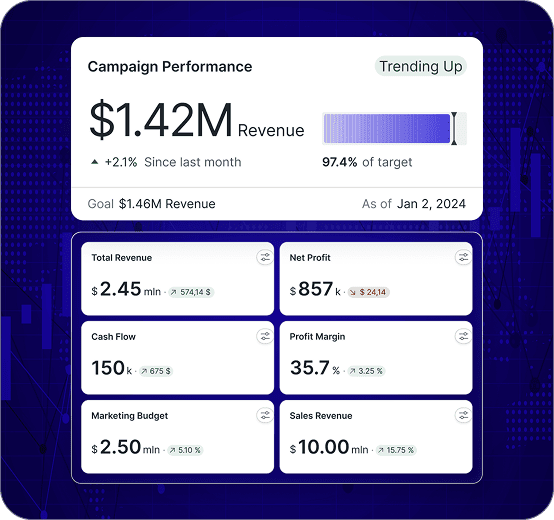
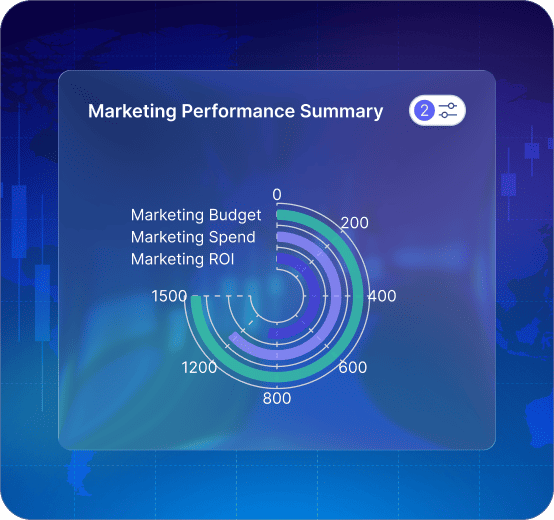
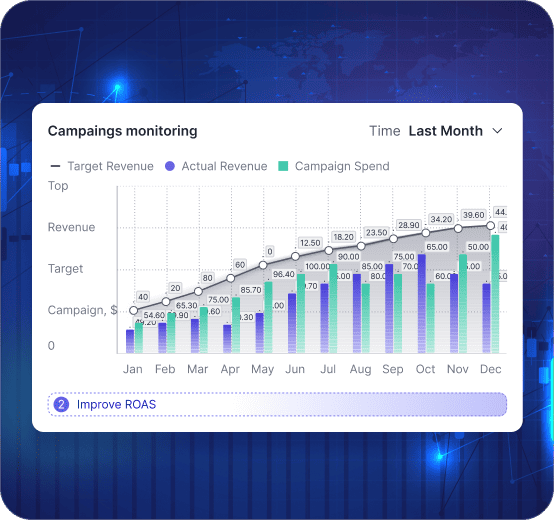
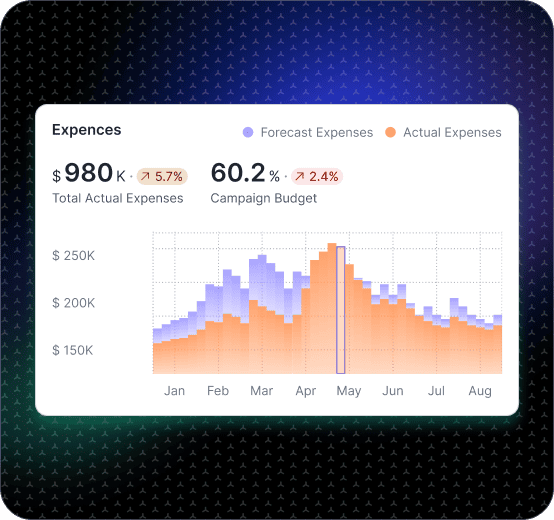
Marketing performance changes in small ways first: one channel gets more expensive, a landing page softens on mobile, or a new campaign shifts conversion quality. Fusedash generates a marketing dashboard that connects spend to outcomes so your team can pace budget, measure experiments, and decide what to scale without guessing. This page is for internal marketing optimization. If you are building client-facing reporting, see the Client Dashboard.

fusedash/ag.drone
Weekly Marketing Decisions

What Your Digital Marketing Dashboard Should Answer Every Week

A good online marketing dashboard makes it obvious whether performance is improving, drifting, or being distorted by spend timing, attribution noise, or experiment effects — so your team spends less time debugging what happened and more time deciding what to do next.

Are we on pace for this month’s goals, or behind due to volume or efficiency?
Which channel is moving first, and is it quality or cost that changed?
What changed in conversion rate by landing page, device, or audience?
Are we seeing diminishing returns as spend increases?
Which experiments are working, and which are consuming budget without impact?
What should we do next: reallocate budget, fix the funnel, or refine targeting?
Marketing Dashboard Views

The Marketing Dashboard Views Internal Teams Use to Run Growth

Internal marketing teams need four views that cover the full optimization cycle: performance by channel, campaign diagnostics, funnel conversion, and a weekly experiment tracker.

Marketing Dashboard Views

The Marketing Dashboard Views Internal Teams Use to Run Growth

Internal marketing teams need four views that cover the full optimization cycle: performance by channel, campaign diagnostics, funnel conversion, and a weekly experiment tracker.

Insights-Driven Platform
Performance Overview

Marketing performance dashboard

A single view of outcomes and efficiency by channel, with trend comparisons that show whether you are gaining momentum or paying more for the same result.

Campaign Diagnostics

Campaign performance dashboard

Break down spend, conversions, CAC, and ROAS by campaign and creative so it is clear what to scale, pause, or rebuild.

Funnel and UX

Conversion dashboard

Track conversion changes by landing page and device to find where drop-offs start and what to test next before CAC rises further.

Experiment Tracking

Testing and learnings dashboard

Track experiments and releases with before-and-after comparisons so wins are repeatable and “gut feel” gets replaced by evidence.

Getting Started

How to Generate a Marketing Dashboard in Fusedash

Start with a view your team will open every week. Once that view is stable, add deeper diagnostics for campaigns, landing pages, and experiments.

Getting Started

How to Generate a Marketing Dashboard in Fusedash

Start with a view your team will open every week. Once that view is stable, add deeper diagnostics for campaigns, landing pages, and experiments.

Insights-Driven Platform
01

Connect the sources that define performance

Bring together ad spend, web analytics, conversion events, and lead or revenue outcomes when available. Start with the minimum sources needed to explain results.

02

Choose your primary outcome metric

Decide what “success” means for your team: revenue, qualified leads, pipeline, or subscriptions. This keeps the dashboard focused and prevents vanity reporting.

03

Create comparisons and pacing views

Use week-to-date and month-to-date pacing, plus prior-period comparisons, so performance drift is visible early.

04

Add drilldowns that match how you optimize

Filters for channel, campaign, creative, landing page, device, audience, and location make optimization faster without rebuilding reports.

Fusedash Builder

Create a marketing dashboard your team can run weekly: clean KPI definitions, fast drill-downs, and shareable views that keep decisions consistent.

Start a free trial

Marketing KPIs to Track First

A marketing dashboard is useful when it connects spend to outcomes and shows early warnings before results miss targets. Start with these four, then break them down by channel, campaign, and landing page to find the driver fast.

Spend pace and budget remaining for the month
CAC trend and ROAS direction by channel and campaign
Conversion rate shifts by landing page and device
Lead or revenue quality signals when available

Budget Pacing That Prevents Late-Month Surprises

Many teams only discover problems at month-end. A good marketing dashboard shows pacing early, so you can shift budget while you still have time to recover results.

Month-to-date pacing vs target and vs prior period
Channel mix changes that explain performance drift
Diminishing returns signals as spend increases
Clear reallocation decisions based on efficiency and quality

ROAS With Context, Not Arguments

ROAS becomes misleading when it is viewed as one number without segmentation. A strong ROAS dashboard shows what changed by campaign, audience, and time window so decisions are clear.

ROAS by campaign and creative with clean time comparisons
New vs returning impact when it matters to your business
Conversion rate and AOV shifts that explain ROAS movement
Breakdowns that show which segment caused the change

Real-Time Monitoring When Performance Shifts Fast

Some weeks you can wait for the daily report. Other weeks you cannot. Real-time monitoring helps you catch drops during launches, promos, tracking changes, or sudden spend spikes.

Spend spikes or delivery changes after campaign launches
Conversion drops after landing page or checkout changes
Tracking or attribution anomalies that distort reporting
Sudden channel drift during promotions or peak periods
FAQs Section

Marketing Dashboard FAQs

Common questions from performance marketing teams building a marketing dashboard, digital marketing dashboard, campaign performance dashboard, ROAS dashboard, or CAC dashboard for internal optimization.

FAQs Section

Marketing Dashboard FAQs

Common questions from performance marketing teams building a marketing dashboard, digital marketing dashboard, campaign performance dashboard, ROAS dashboard, or CAC dashboard for internal optimization.

What is a campaign performance dashboard?

A campaign performance dashboard is a diagnostic view that breaks down marketing spend, conversions, CAC, and ROAS by campaign and creative — so the team can see clearly what to scale, pause, or rebuild rather than averaging performance across the portfolio. Where a channel-level view shows overall performance trends, a campaign performance dashboard goes one level deeper: it isolates which specific campaigns are driving efficiency gains or losses, which creatives are fatiguing, and which audiences are converting at a profitable CAC. The most useful campaign performance dashboards include time comparisons (this period vs prior period) and breakdowns by placement, audience, device, and creative format so campaign managers can make reallocation decisions without exporting data.

What is a ROAS dashboard?

A ROAS dashboard is a marketing performance view that tracks return on ad spend by campaign, creative, audience, and time window — with the segmentation needed to make ROAS a decision metric rather than a blended number. ROAS without context is misleading: a high blended ROAS can mask a campaign mix where one profitable channel is subsidising several unprofitable ones. A ROAS dashboard makes this visible by breaking down ROAS alongside CAC, conversion rate, spend, and average order value (or deal size) for each campaign segment — so the team can see which campaigns are genuinely efficient and which are being averaged away by portfolio blending. The most useful ROAS dashboards include period comparisons, new vs returning customer splits, and a blended view alongside the segmented view so gains in one area are not obscuring losses elsewhere.

What is a CAC dashboard?

A CAC dashboard is a marketing performance view that tracks customer acquisition cost by channel, campaign, audience, and creative — alongside the conversion volume and lead or revenue quality signals that make CAC meaningful. CAC in isolation is incomplete: a low CAC is only valuable if the customers acquired are worth keeping. A CAC dashboard connects acquisition cost to downstream outcomes — pipeline stage, closed revenue, or subscription value — so the team can distinguish between cheap-but-low-quality conversions and efficient acquisition of customers who actually generate return. The most useful CAC dashboards show CAC trend over time alongside spend changes, so the team can see whether CAC is rising because of volume scaling (spend increase, efficiency holds) or efficiency loss (spend stable, conversion rate dropping).

What is budget pacing in marketing?

Budget pacing in marketing is the practice of tracking how quickly a team is spending its allocated budget relative to where it should be at any point in the month or quarter — and using that pacing view to make early reallocation decisions before performance misses targets at month-end. A budget that is pacing behind means traffic or conversions may fall short of the monthly goal; a budget pacing ahead means spend is accelerating, which can signal diminishing returns (paying more per conversion as audiences saturate) or an unexpected delivery spike. A budget pacing dashboard shows month-to-date spend vs target, channel mix changes, efficiency trends as spend increases, and clear reallocation signals — so the team can shift budget while there is still time to recover results rather than discovering the problem on the last day of the month.

What should a campaign performance dashboard include first?

Start with budget pacing, spend, and outcomes in the same view: spend by channel, conversions (or pipeline), CAC, ROAS, and a clear time comparison (last 7 vs prior 7, MTD vs prior MTD). Then add breakdowns by campaign, audience, creative, device, and landing page — in that order, from highest spend impact to most granular diagnostic.

How do marketing teams use a marketing dashboard day to day?

Use it as a control panel: confirm pacing vs plan, check channel mix, spot what changed since yesterday, and drill into the segment causing movement. The goal is fewer meetings about “what happened” and more action on “what to do next.”

How do I build a CAC dashboard that helps me act?

Treat CAC as a decision metric, not a vanity number. Show CAC by channel and campaign, include volume (conversions), and add segment drilldowns (audience, creative, geo, device). Pair CAC with lead quality signals when you have them so you do not optimize for cheap but low-value conversions.

Can I track experiments and creative performance in the same dashboard?

Yes. Add an experiments view that compares test vs control (or variant A vs B) and shows lift on one primary outcome. For creative, track spend, CTR, CVR, CAC/ROAS, and frequency, then filter by placement, audience, and time window. Keep the primary outcome metric consistent between experiments so lift is comparable across tests.

Is this different from a client reporting dashboard?

Yes. This page is built for internal marketing teams optimizing their own campaigns — budget pacing, channel mix, CAC, ROAS, experiment tracking, and funnel conversion for your own business. A client reporting dashboard is built for agencies and teams who need to share performance with external clients in a clean, presentation-ready format — typically hiding internal diagnostics and focusing on the metrics clients care about most. If you are building internal performance views for your own marketing team, this page is for you. If you are building client-facing reports, see the Client Dashboard.

Ready to Generate a Decision-Ready Marketing Dashboard?

Track CAC, ROAS, channel mix, and conversion drivers in one marketing dashboard. Pace budget, measure experiments, and spot shifts early.