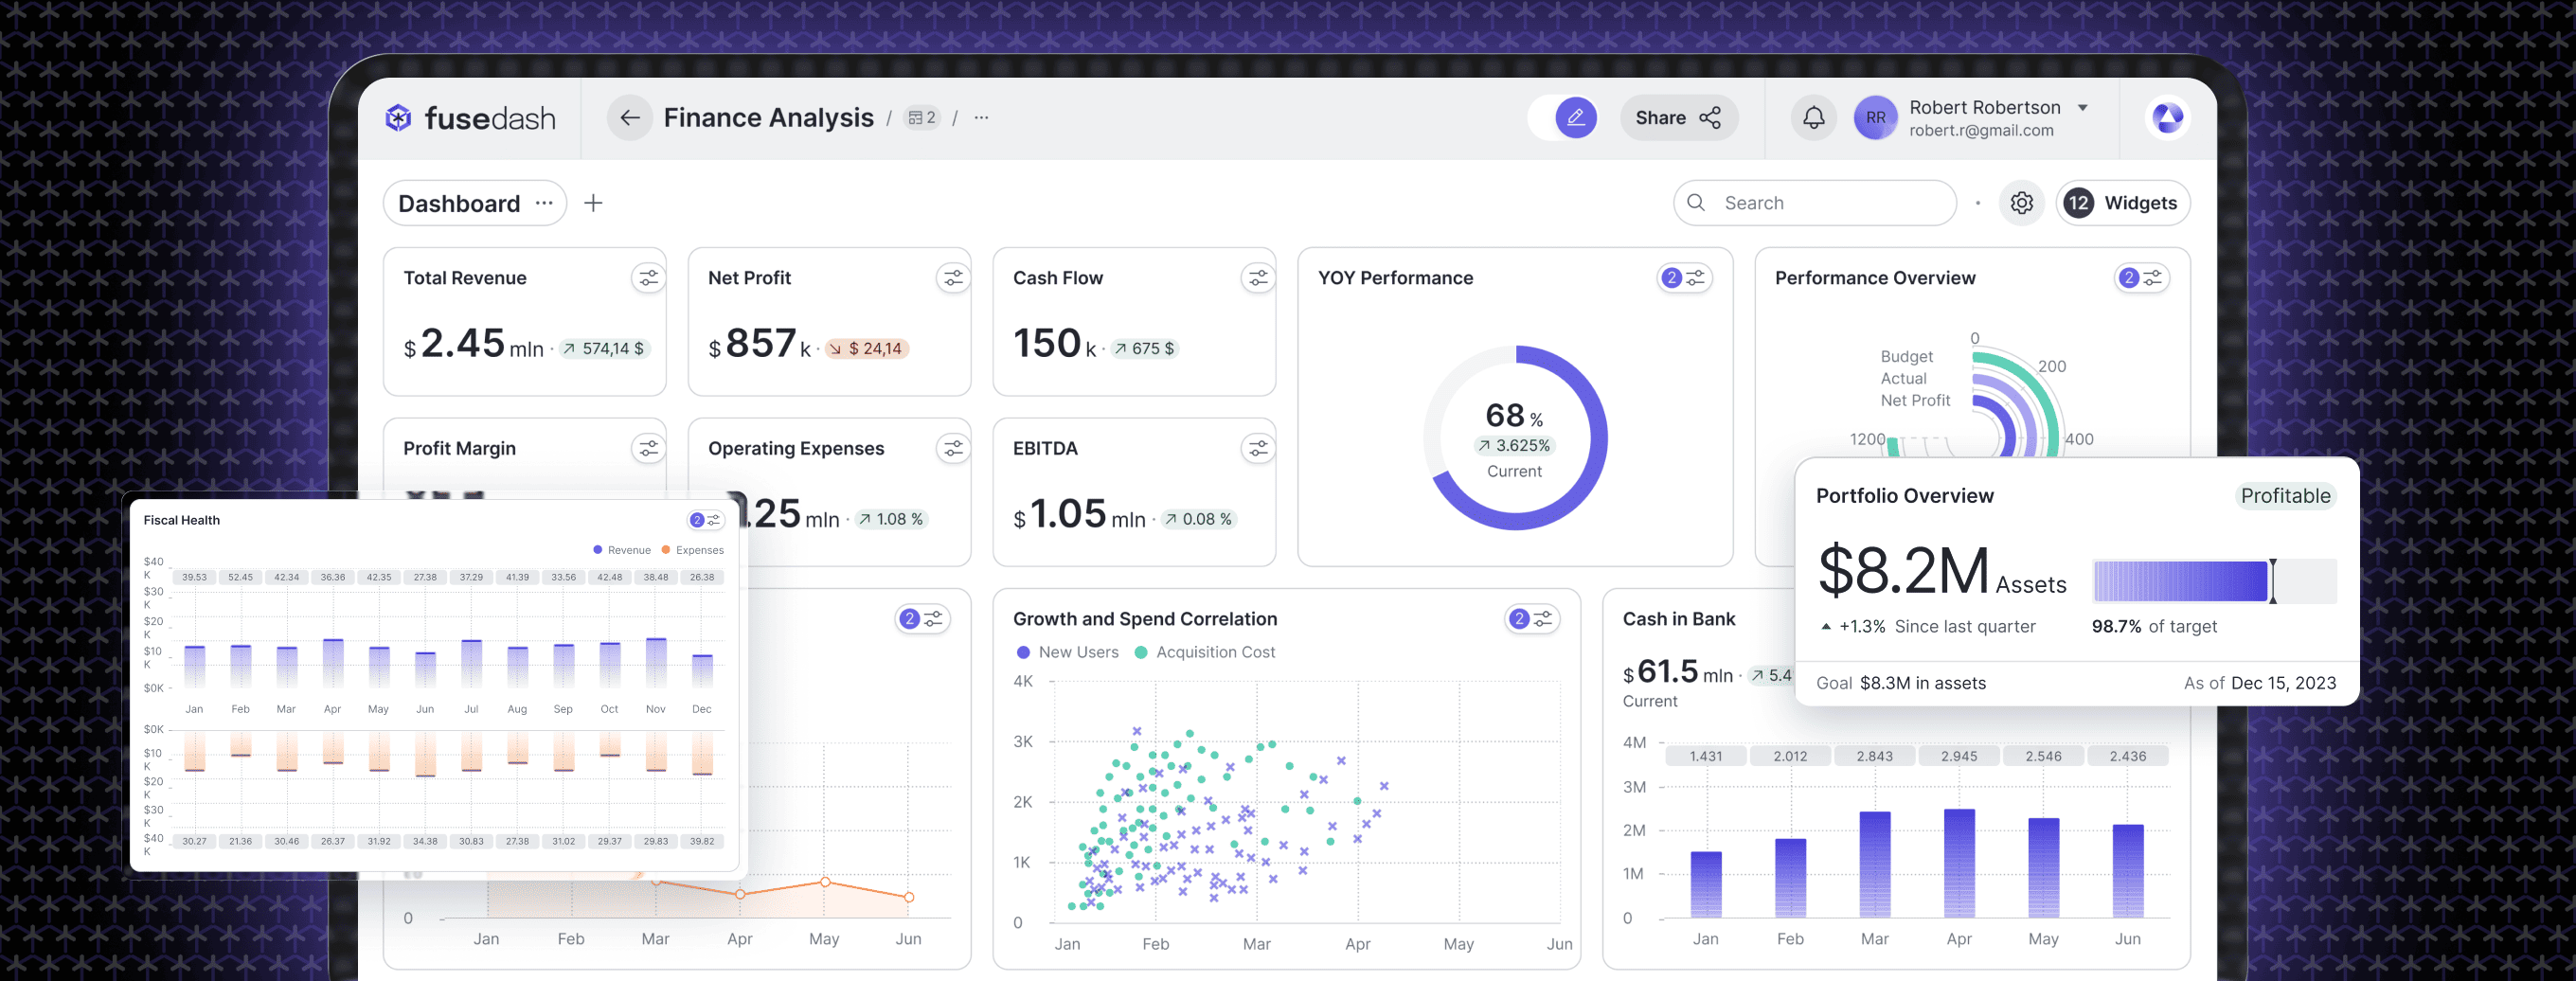
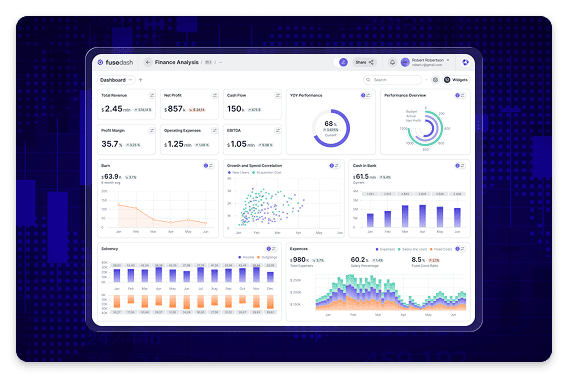
Finance Dashboard for Close Reporting and Planning.

Budget vs actual, cash flow, close reporting, and forecasting in one view

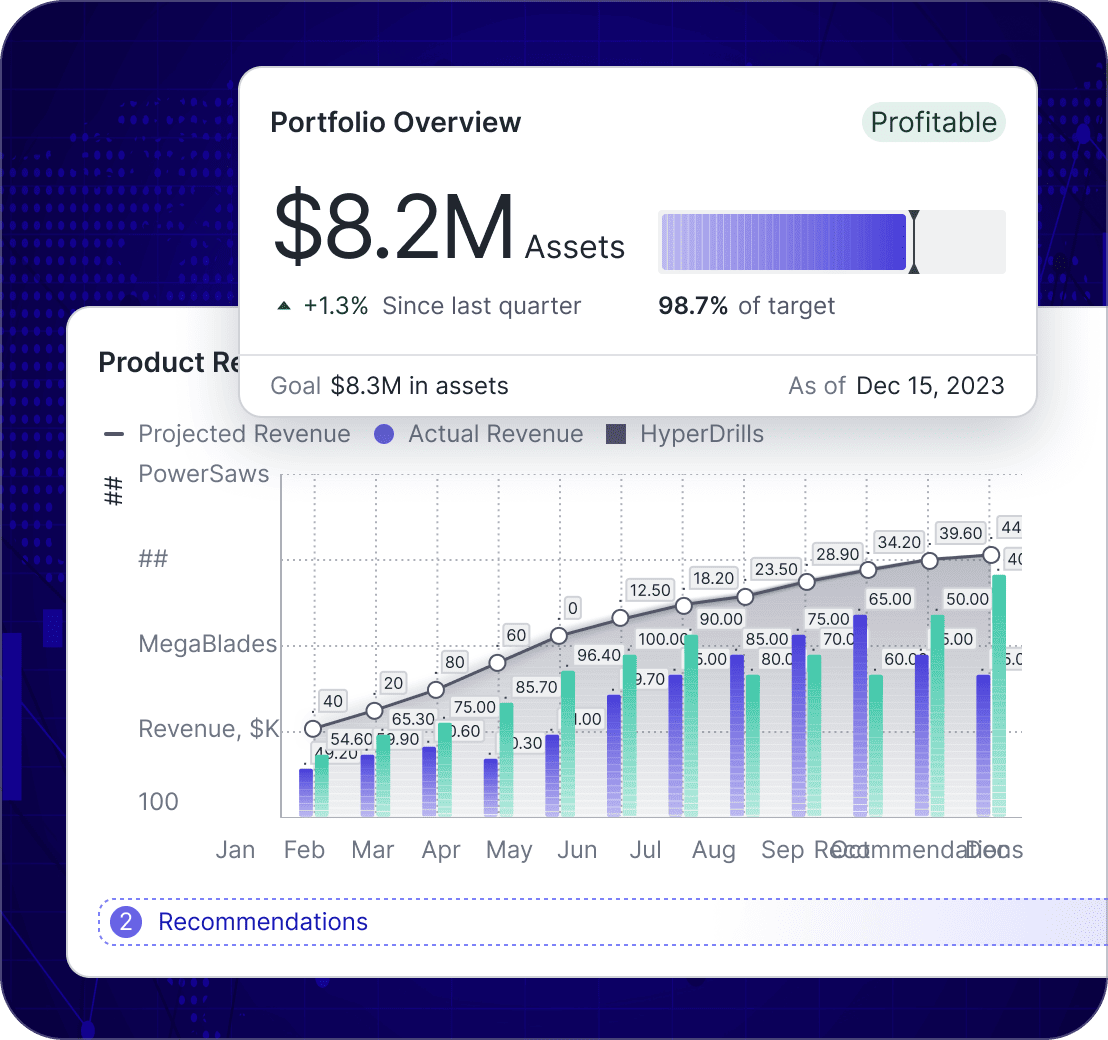
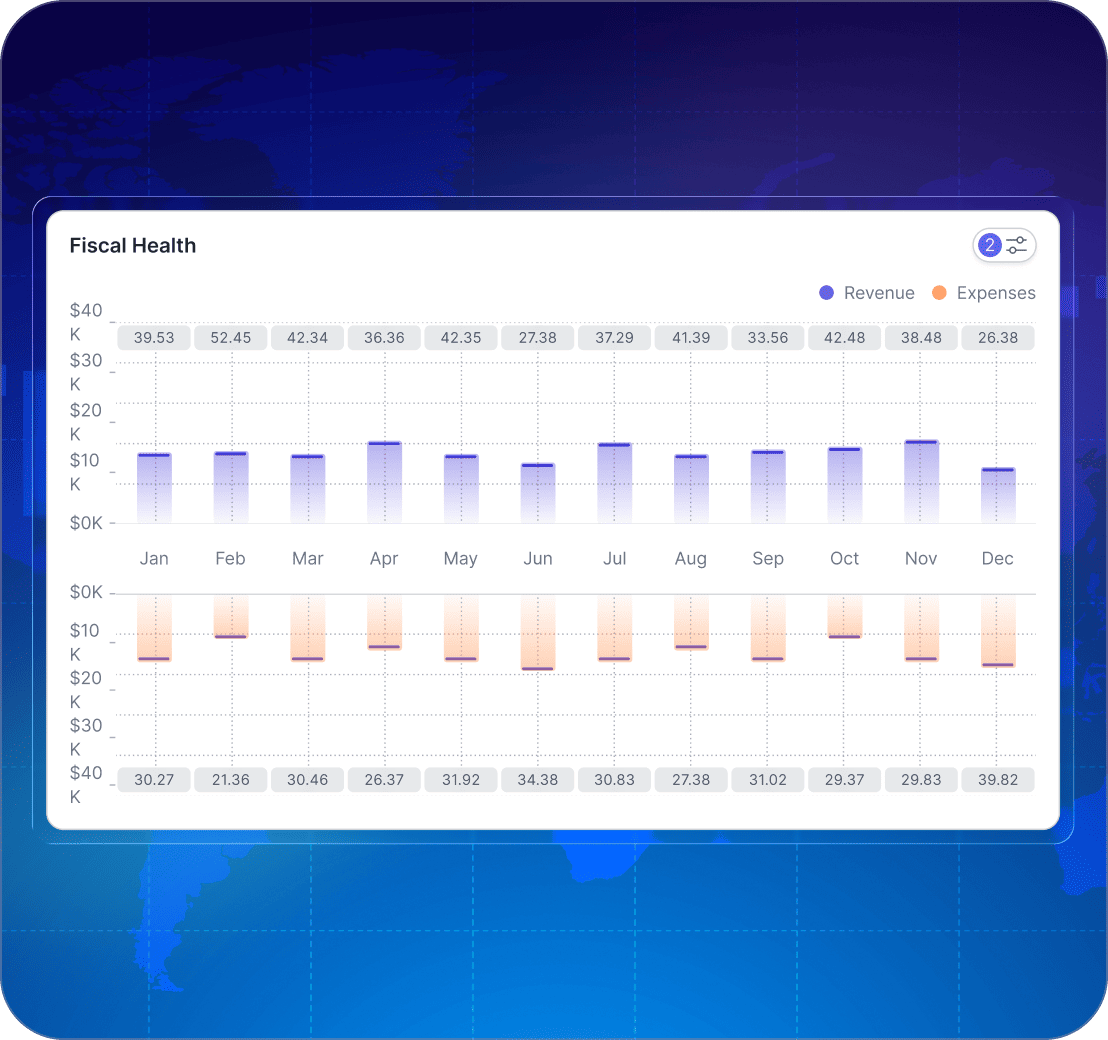
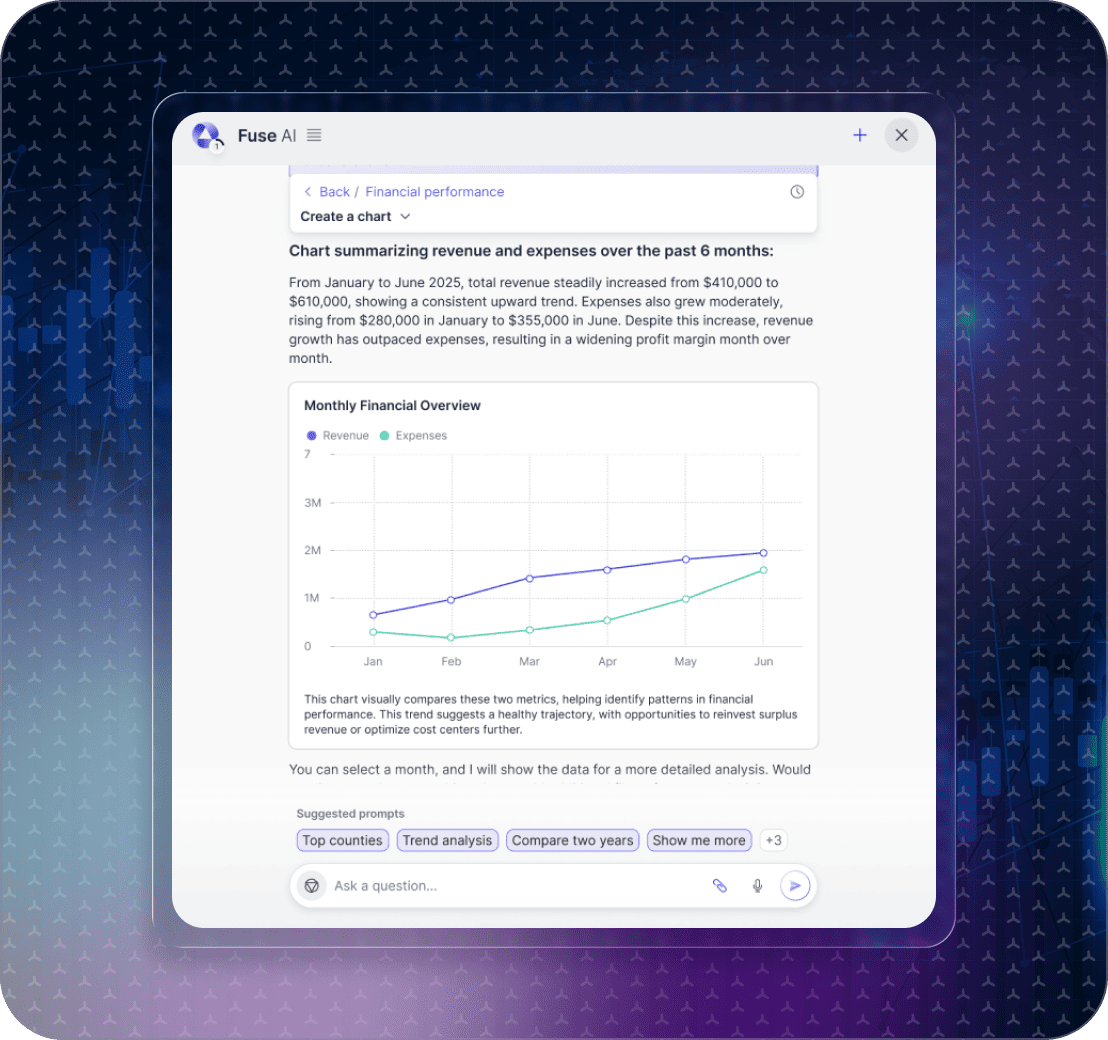
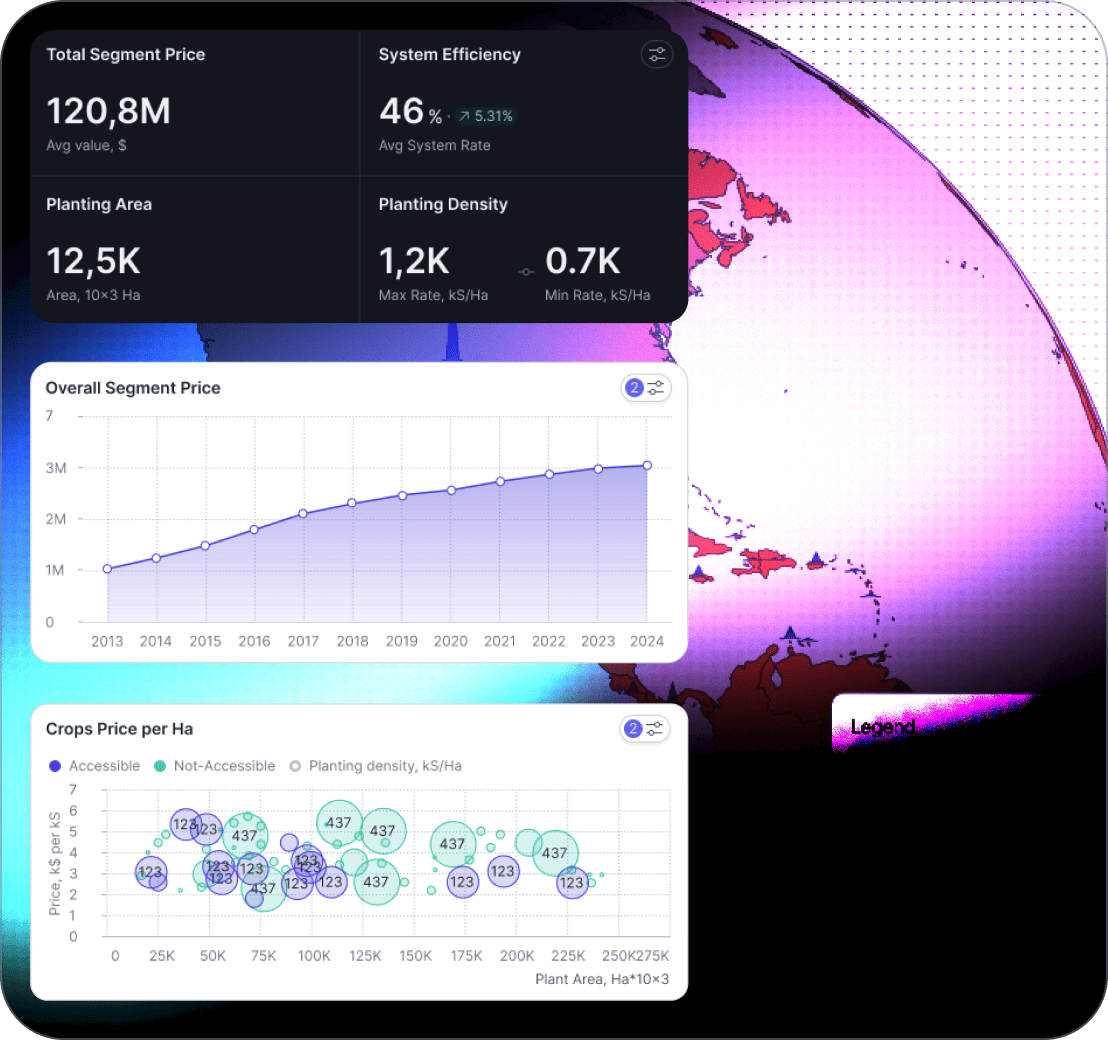
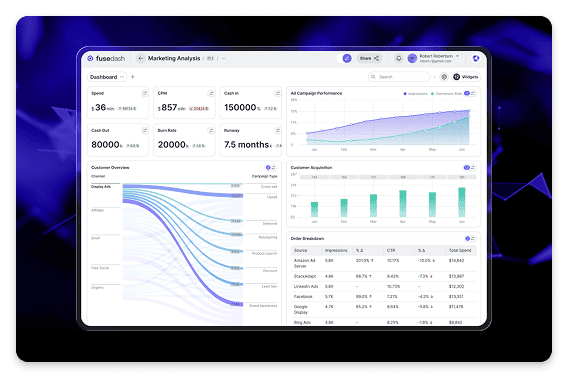
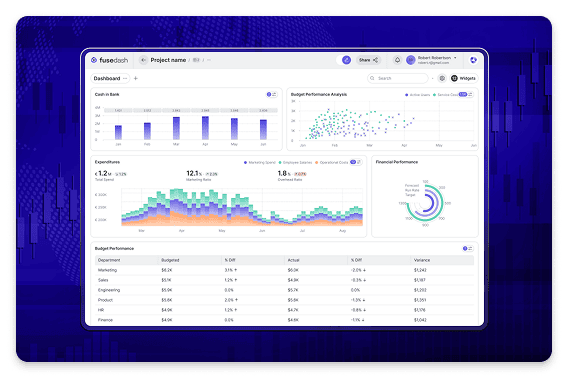
Use it as a cash flow dashboard for runway visibility, a budget vs actual dashboard for department accountability, a P&L dashboard for performance review, and a forecasting dashboard to track variance as assumptions change. This page covers internal finance planning and reporting. For banking and fintech performance monitoring across products, channels, and regions, see the Financial Services dashboard.

fusedash/ag.drone
Finance Close Rhythm

What Your Finance Dashboard Should Make Faster Every Month

A finance dashboard compresses the time between close and decision-making. It shows performance vs plan, highlights what changed, and makes variance explainable without hunting across tabs — so the story is ready before leadership asks.

Are we ahead or behind plan, and which line items drove the variance?
What is cash direction, and are we trending inside runway expectations?
Which departments are over or under budget, and why?
What changed since last close: price, volume, mix, headcount, or timing?
How is forecast variance trending, and are assumptions still valid?
What should we do next: reforecast, cut, invest, or investigate deeper?
Finance Dashboard Views

The Finance Dashboard Views Teams Use for Close and Planning

Finance teams need stable, repeatable views that survive the close cycle without being rebuilt. One for the P&L, one for cash, one for budget accountability, and one for forecasting and variance — the same four views, every month.

Insights-Driven Platform
Close Reporting

P&L dashboard (monthly performance)

A clear view of revenue, COGS, gross margin, and operating expenses with period comparisons so performance is obvious immediately.

Cash Visibility

Cash flow dashboard (runway direction)

Monitor cash in, cash out, burn, and runway direction with trend context that helps leaders understand timing risk.

Budget Accountability

Budget vs actual dashboard (department owners)

Compare actuals vs budget by department and category, then drill into the biggest variances to explain what changed and what needs action.

Forecasting

Forecast variance dashboard (assumptions and drift)

Track forecast accuracy, reforecast cycles, and variance drivers so the team sees drift early and updates assumptions with confidence.

Getting Started

How to Generate a Finance Dashboard in Fusedash

Start with the views you repeat every month. The best finance dashboard is not the most detailed, it is the most reliable and easiest to explain.

Getting Started

How to Generate a Finance Dashboard in Fusedash

Start with the views you repeat every month. The best finance dashboard is not the most detailed, it is the most reliable and easiest to explain.

Insights-Driven Platform
01

Connect your close and budget sources

Import close outputs, budget models, and planning files via CSV or connect to your data sources. Start with the tables that finance already trusts.

02

Standardize the chart of accounts and mapping

Align account categories, departments, and cost centers so the dashboard reflects how finance reports internally and avoids category drift.

03

Create variance-first reporting views

Create views where variance is the default lens. Show actual vs budget, actual vs forecast, and period-over-period so the finance story is clear.

04

Add drilldowns for explanations, not noise

Drill into department, category, vendor, and project views so variance is explainable without exporting and rebuilding.

Fusedash Builder

Create finance reporting your team can trust: consistent mappings, variance drilldowns, and shareable views for leadership and budget owners.

Start a free trial

Finance KPIs to Track First

A finance dashboard is only as useful as the KPIs it makes repeatable across every close cycle. Start with these four, then break them down by department and category to explain variance fast.

Actual vs budget variance and variance % by month and department
Cash balance, burn direction, and runway trend
P&L performance with gross margin and operating expense movement
Forecast variance and assumption drift across major line items

Close Reporting That Stays Consistent Quarter After Quarter

Finance teams lose time when every variance becomes a meeting. A budget vs actual dashboard should make accountability clear and keep conversations grounded in the same definitions.

Department views that show the biggest variances first
Category drilldowns that explain what changed and why
Consistent time windows so owners stop debating periods
A clean summary for leadership plus detail for budget owners

Close Reporting That Stays Consistent Quarter After Quarter

A financial reporting dashboard should preserve the same structure each close, so leadership knows where to look and finance spends less time rebuilding the same pack.

A recurring P&L view with stable categories and comparisons
Month-to-date and quarter-to-date context for performance
A clear “what changed” focus for the variance story
Shareable views that replace screenshot decks

Forecasting Dashboards That Show Drift Early

Forecasts fail slowly. A forecasting dashboard helps you see where assumptions stop matching reality so reforecasting happens before surprises compound.

Forecast vs actual variance trends across key line items
Early warning signals for spend run-rate acceleration
Scenario comparisons when assumptions change
A clear view of what moved since the last forecast cycle
Create clearer variance and scenario views, and turn forecast updates into a narrative your leadership team can act on.
FAQs Section

Finance Dashboard FAQs

Common questions from finance teams building a finance dashboard, financial reporting dashboard, budget vs actual dashboard, cash flow dashboard, P&L dashboard, or forecasting dashboard for monthly close and planning cycles.

FAQs Section

Finance Dashboard FAQs

Common questions from finance teams building a finance dashboard, financial reporting dashboard, budget vs actual dashboard, cash flow dashboard, P&L dashboard, or forecasting dashboard for monthly close and planning cycles.

What is a finance dashboard?

A finance dashboard is a single view of financial performance and planning that helps teams run a consistent reporting rhythm. It typically includes a P&L view, cash flow signals, and planning metrics like budget vs actual and forecast variance so finance can spot drift early and guide decisions.

What is a budget vs actual dashboard?

A budget vs actual dashboard is a financial reporting view that compares what a team or department planned to spend or earn (the budget) against what actually happened (the actuals), broken down by period, department, cost category, and major line item. It is the primary accountability tool for finance teams running a budgeting cycle: rather than reviewing a raw P&L, a budget vs actual dashboard shows variance — the gap between plan and reality — alongside the percentage variance and the specific drivers behind it. The most useful budget vs actual dashboards show month-to-date and quarter-to-date comparisons so department owners can see whether a variance is a one-month anomaly or a compounding trend, and whether it requires a conversation, a reforecast, or an action.

What is a P&L dashboard?

A P&L dashboard is a financial reporting view that presents a company's profit and loss statement in a visual, interactive format — showing revenue, cost of goods sold, gross margin, operating expenses, and operating profit or loss for a given period, with comparisons against the prior period and against plan. Where a static P&L report is a snapshot compiled after close, a P&L dashboard is a recurring, consistent view that finance teams use throughout the close cycle and in monthly leadership reviews. The most useful P&L dashboards show period-over-period comparisons alongside plan variance so the reader can immediately see both how performance trended and how it measured against expectations — without needing to cross-reference a separate budget file.

What is a forecasting dashboard?

A forecasting dashboard is a financial planning view that tracks how closely a team's predictions are matching actual outcomes — and where the gap is growing. Unlike a P&L or budget vs actual view, a forecasting dashboard is forward-looking: it shows forecast variance (the difference between what was predicted and what is happening), identifies the line items where assumptions are drifting furthest from reality, and gives the finance team early warning signals to trigger a reforecast before a surprise reaches leadership. The most useful forecasting dashboards track variance by major line item over rolling forecast cycles, so the team can see not just what the current gap is, but whether the gap is widening, narrowing, or holding steady across periods.

Is this different from the Financial Services dashboard?

Yes. This page is built for internal finance teams managing planning and reporting — the monthly close cycle, budget vs actual tracking, cash flow direction, and forecast variance for a company's own operations. The Financial Services dashboard is built for companies that operate in financial services industries — banks, fintechs, lending platforms, and payment processors — who need to monitor external-facing product performance, transaction reliability, channel performance, and regulatory metrics across their customer portfolio. If you are a CFO, finance manager, or FP&A analyst tracking your company's internal P&L, cash, and budget, this page is for you. If you are a product or operations leader at a fintech or bank tracking performance across products, channels, and regions, see the Financial Services dashboard.

What should a financial reporting dashboard include first?

Start with the core leadership view: revenue, gross margin, operating expenses, and operating profit, with comparisons against plan and the prior period. Add a simple “what changed” summary plus drilldowns by department, product line, or entity so reporting stays fast and consistent.

What should a budget vs actual dashboard include first?

Begin with budget vs actual by department and major line items, then include variance to plan, variance % and a short variance driver view. The most useful layout shows month-to-date and quarter-to-date so owners can see whether the drift is compounding.

What should a cash flow dashboard track?

A cash flow dashboard should focus on liquidity and runway signals: cash balance trend, inflows and outflows, burn direction, AR and AP timing, and key working capital drivers. Add scenario views only after the basic timing picture is reliable.

How does a forecasting dashboard help finance teams?

Forecasts fail slowly. A forecasting dashboard helps you see where assumptions stop matching reality so reforecasting happens before surprises compound. Track forecast vs actual variance trends, early warning signals like spend run-rate acceleration, and what moved since the last forecast cycle.

How do finance teams use dashboards during month-end close?

A dashboard keeps close aligned by showing completion status, late inputs, and the latest view of results as entries land. It also reduces back-and-forth by centralizing the latest numbers, plan comparisons, and the top variance drivers before leadership review.

Ready to Generate a Finance Dashboard Your Team Can Trust?

Generate a finance dashboard that tracks budget vs actual, cash flow direction, P&L performance, and forecast variance in one consistent view — so close is faster, variance is explainable, and leadership always sees the same numbers.