Operations Dashboard for Throughput, Cycle Time and Bottleneck Tracking
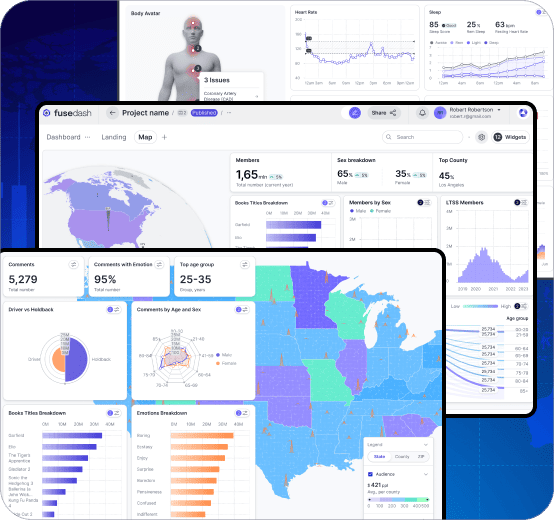
Track throughput, cycle time, WIP, and productivity in one operations KPI dashboard
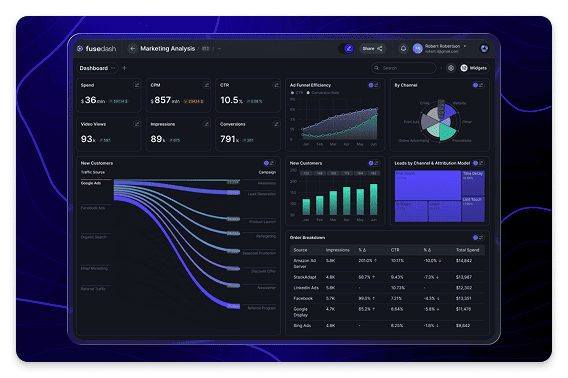
Operations performance does not fail with one big number. It fails in flow: work piles up in one step, cycle time stretches, and the backlog becomes normal until customers feel it. Fusedash generates an operations dashboard that makes flow visible so teams can spot bottlenecks early, keep work moving, and improve process performance week after week.


.jpg)
.png)