Real-Time Dashboards Explained
Real-time dashboards are gaining more momentum now as the need for moment-to-moment information has shot up across industries. Does that mean such dashboards are needed everywhere? It is a question often asked because such dashboards are often misconstrued as a “one-size-fits-all” system.
In this article, we provide the core meaning of a real-time dashboard while revealing when real-time data visualization works and when it could be considered overkill.
What “real-time” actually means
Real-time refers to the updating of information as it happens. In trading, for instance, stock prices are updated within milliseconds, allowing investors to take action quickly. Another popular example is online gaming: as soon as an enemy is taken down, the “score” goes up.
The entire focus of “real-time” is simple: the data should be fresh, and the source should be in motion.
Freshness vs latency
Freshness refers to how current the data is when it appears on the dashboard. Here is an example:
An eCommerce company may look at the order status over the last 30 seconds. In this case, the metric “30 seconds” would be considered the freshness of the data, and the tab might say something like, “the data reflects the order status in the last 30 seconds.”
Freshness reveals when the data was generated at the source. The data is often refreshed every second (or millisecond). Since data is displayed continuously by necessity, it is common for a dashboard to show stale data when information is missing or delayed. Therefore, in operational dashboards, freshness should not be the sole metric for decision-making.
Another metric is latency, which refers to the time difference between when an event occurred and when it was displayed on screen. Suppose an order goes out at 1:00 am and the data about it is displayed at 1:01 am; this represents a “1-minute” latency.
This time difference accounts for when data is generated, ingested, processed, stored, and displayed. Low latency means data appears on the dashboard quickly, while high latency means there is a lag between data reality and visualization.
Freshness and latency are not the antithesis of each other. Data can be fresh but still have high latency. At the same time, data can have a high freshness rate and still be stale. The goal of real time is to focus on predictable delay. Some latency is expected and even accepted for the sake of data accuracy. However, if latency becomes too high, decision-making will be disrupted.
Refresh intervals and tradeoffs
A refresh interval is how quickly a real-time dashboard updates the visuals with information. For someone broadcasting on Twitch, true streaming, in which data updates continuously, is the focus. But in cases such as voting, fixed intervals for polling-based refreshes are used.
If the refresh rate is shorter, it can be mistaken as having a strong real-time capability. However, that is what creates tradeoffs. A faster dashboard refresh rate increases infrastructural load due to higher computational and bandwidth costs. This can amplify visual noise. Excessive noise creates distraction, delaying decision-making.
Longer intervals, on the other hand, lighten the load on systems. However, longer delays can make users less aware of changes. In operational systems, long intervals can be an issue, but for analytical and assessment systems, they often are not.
Here is a rule of thumb when choosing an appropriate refresh rate:
Paced enough to help you act on time while keeping systems stable and data trustworthy.
When real-time dashboards matter
As we already established at the start of the article, real-time dashboards matter, but only under certain conditions. Here are a few of them:
Incident monitoring:
When a particularly unknown type of incident has occurred, you need to get information about it immediately. Not relying on real-time data visualization in this case means becoming unaware of the event.
If the event is critical and capable of triggering a chain reaction that impacts the entire operation, getting information about it as it happens becomes essential. A real-time interface provides visibility into why the incident occurred and what can be done to prevent or promote similar outcomes in the future.
Checkout issues:
When a customer has spent hours picking a product, they just want to buy it. So, when issues during checkout occur, you cannot put them into a file to analyse later. It is an operational problem that must be solved quickly, which means getting alerts through real-time data visualization about these issues while they happen is critical.
Getting information about such issues on time allows your team to act quickly. The team may provide the customer with an alternative link. This leads to quick resolution and a seamless buying experience for the customer.
Marketing pacing:
When you are running a marketing campaign, you cannot afford to look at the information later. If you do, you will not be able to monitor which channels are underperforming and which are performing as intended (or even better).
With real-time information, you can detect drops or surges in your marketing efforts, allowing you to make adjustments quickly. For example, you may want to dial back on “WhatsApp leads” since they are not producing results, and focus more on on-page blogs if they are generating higher interest from customers.
Operations bottlenecks
In operational environments, it is not a “single failure” that makes a system crumble. Small chokepoints can emerge during an operation, compounding into a larger problem. Such instances may go unnoticed when there is no real-time insight.
With a live dashboard, however, these bottlenecks can be identified quickly, allowing corrective action to be taken on time.
When scheduled reporting is better
Sometimes, real-time reporting is given more weight than it should be. Immediacy is not the priority when reconciliation, stability, and completeness matter more. In such cases, scheduled reporting is the better option.
Finance close
Finalising financial records requires precise information. Real-time reporting cannot support this process, since financial data often repeats or adjusts during operational activity. What executives need is an overall view, which becomes clear only after a defined schedule during which sufficient data is collected.
With finalised, validated numbers for specific intervals, scheduled reporting offers decision-makers consistent, auditable information to work with.
Monthly reviews
Real-time data is required when an operation needs to be analysed while it is in motion. However, when it is time to assess overall performance based on outcomes, essentially during monthly reviews, such a granular assessment can become a distraction. Short-term volatility mistakenly takes priority, and overall results are ignored.
Therefore, scheduled reporting is preferred. It offers a complete view of performance by focusing on clear performance narratives built on complete data.
Low volatility metrics
There are metrics with low volatility that change slowly or infrequently. These include customer churn during stable markets, infrastructure capacity utilisation, or long-term retention rates.
Since these metrics do not change within shorter time frames, monitoring them in real time is a waste of resources. In fact, it can create false immediacy even when no action is required.
Scheduled reporting is more appropriate here, as it focuses on clear shifts that occur over longer time frames. Such reporting relies on periodic snapshots for analysis, creating key insights that decision-makers can act on.
Risks of real-time dashboards
As already established, not all data needs constant monitoring. In some cases, real-time monitoring becomes more of a distraction. It amplifies needless urgency, causing decision-makers to look away from the issues that truly require attention.
Noise and false alarms
Since real-time dashboards monitor fluctuations, they can create a sense of urgency even when normal variation occurs in the information flow.
Suppose a customer takes slightly longer to check out. While this is not particularly noteworthy, real-time metrics can amplify this simple variable into an issue. eCommerce executives may misinterpret it as customers drifting away from their products.
Such false alarms can ultimately destroy trust in the dashboard.
Overreacting
Real-time data prompts data watchers to react quickly. If companies are live-monitoring the wrong metric, this reaction can turn into an overreaction.
For instance, during peak seasons, there are periods when orders slow down at certain hours. The “would-be” customers may simply be busy elsewhere. However, real-time monitoring can make executives anxious about this short-term volatility.
One example of overreaction is introducing new strategies on the fly to attract customers. Such plans can be haphazard, yet appear justified in the moment. That is the issue. Patience is often required here, which means there is no need to closely monitor specific “order rates” during peak seasons.
Decision tree: real-time vs hourly vs daily
Deciding whether to opt for real-time monitoring or move to hourly or daily reporting should be based on how quickly a decision needs to be made. Below is a decision tree to help determine the right reporting frequency.
Step 1: Assess How Quickly Do You Need to Take Action
- If delays of even a few minutes can cause financial loss, system damage, or customer issues, sticking with a real-time analytics dashboard is the right choice.
- However, if the requirement is a periodic review of an operation, hourly or daily reporting is sufficient.
Step 2: Assess the Metric’s Volatility
- If you are dealing with highly volatile metrics such as traffic by channel, campaign performance, queue length, or concurrent users, choose hourly or real-time reporting.
- If the focus is on customer lifetime value, long-term churn, or average order value, daily reporting is more appropriate.
Step 3: Assess Whether Data Can Change After Collection
If the data can be corrected or adjusted after collection, real-time monitoring may not be necessary. Therefore:
- For successful orders, failed payments, system errors, or incident counts, real-time monitoring is effective.
- However, when working with adjusted or provisional metrics such as financial aggregates, hourly or daily reporting is better suited.
Step 4: Assess the Cost of Early Reaction
If false positives can cause issues, slower reporting is the safer option.
- For short-term conversion rates, A/B testing results, and single-session engagement metrics, hourly or daily reporting is usually preferable.
- However, when fraud signals, service outages, or payment gateway health are the priority, real-time monitoring is advised.
Step 5: Assess How Quickly Teams Can Make a Decision
Always ensure that reporting and decision speed match. Therefore:
- For incident alerts, real-time reporting is required.
- When trend-aware decisions are needed, hourly reporting is appropriate.
- For strategic decisions tied to a company’s long-term growth, daily reporting is the better choice.
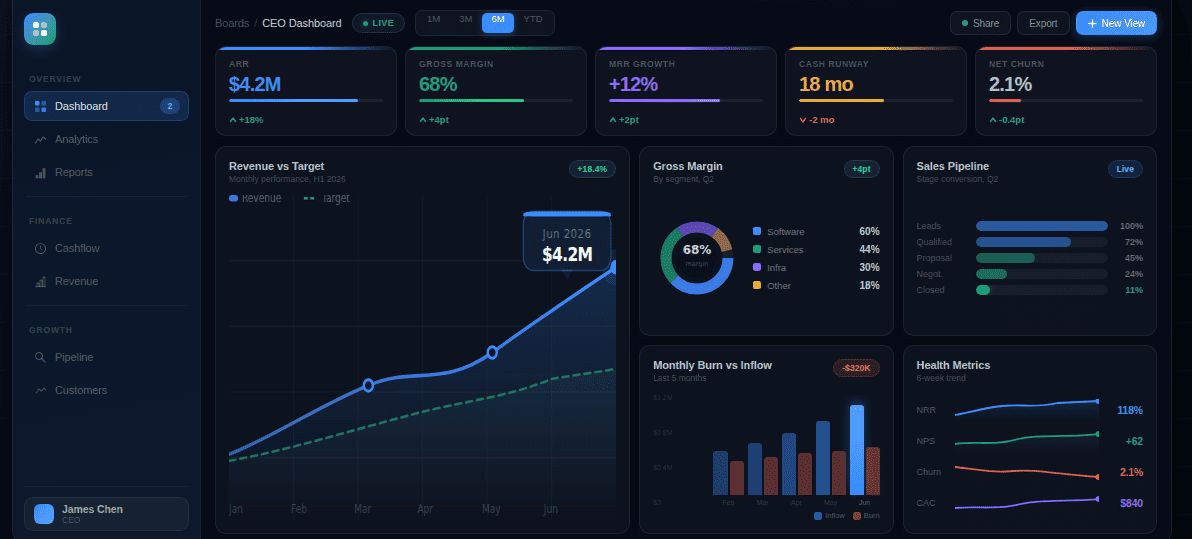
A real-time dashboard displays metrics with minimal delay so teams can detect issues and act quickly. It’s best for time-sensitive operations where minutes matter.
Build a real-time monitoring view