Play
Analytics
July 3, 2026
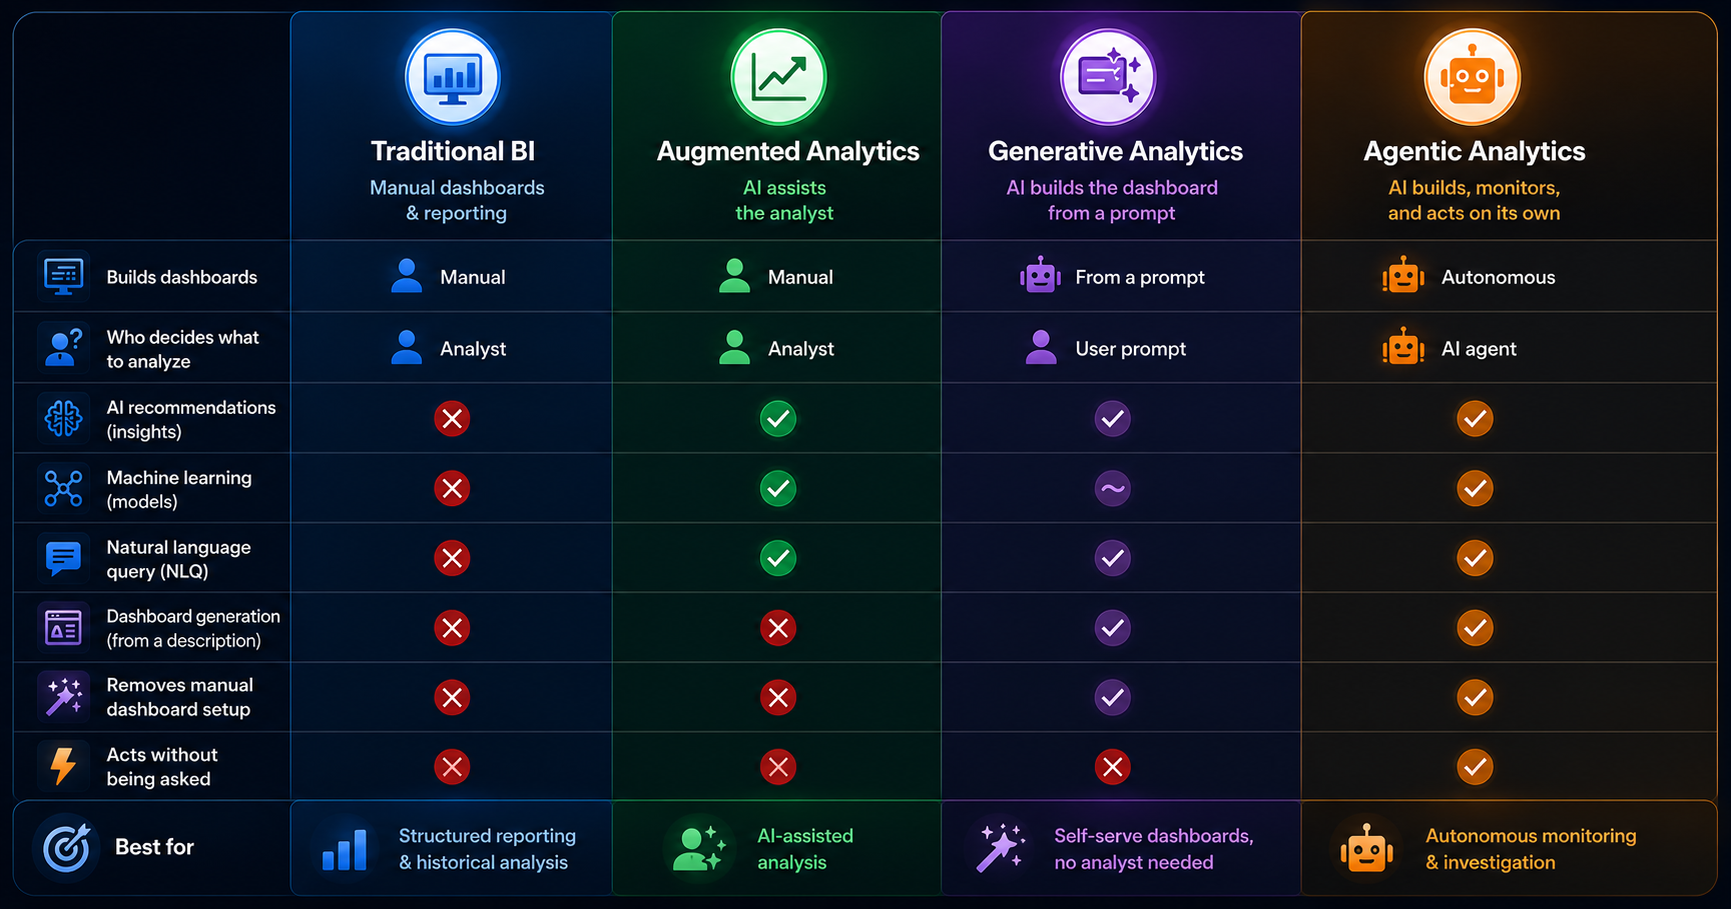
Augmented analytics vs generative analytics vs traditional BI (2026)
Dashboards
Read More
May 21, 2026
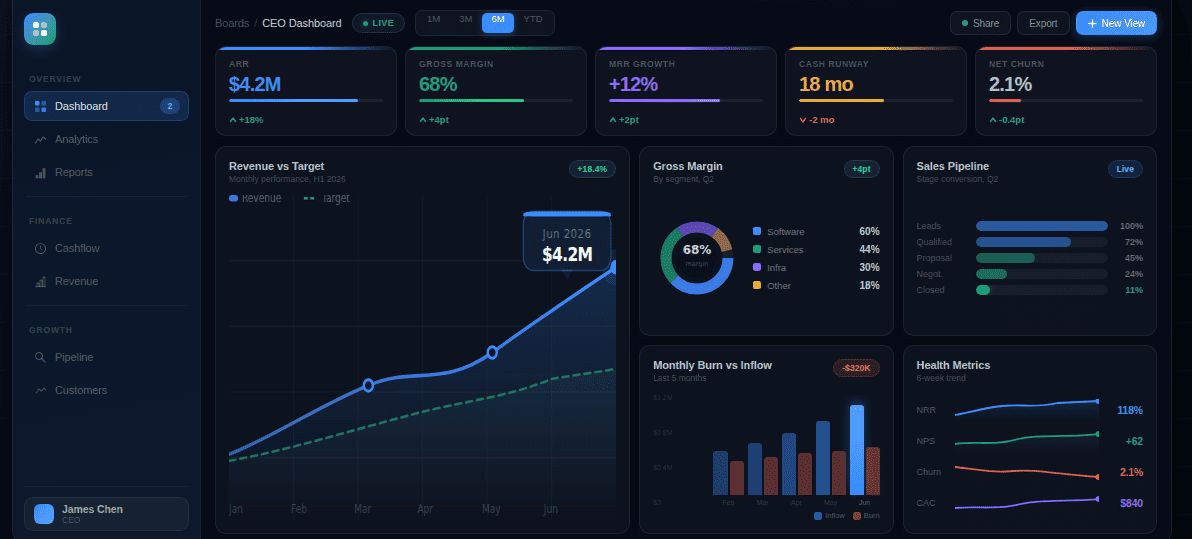
The CEO Dashboard: What Belongs on It at Each Stage and What Doesn't
Dashboards
Read More
May 13, 2026
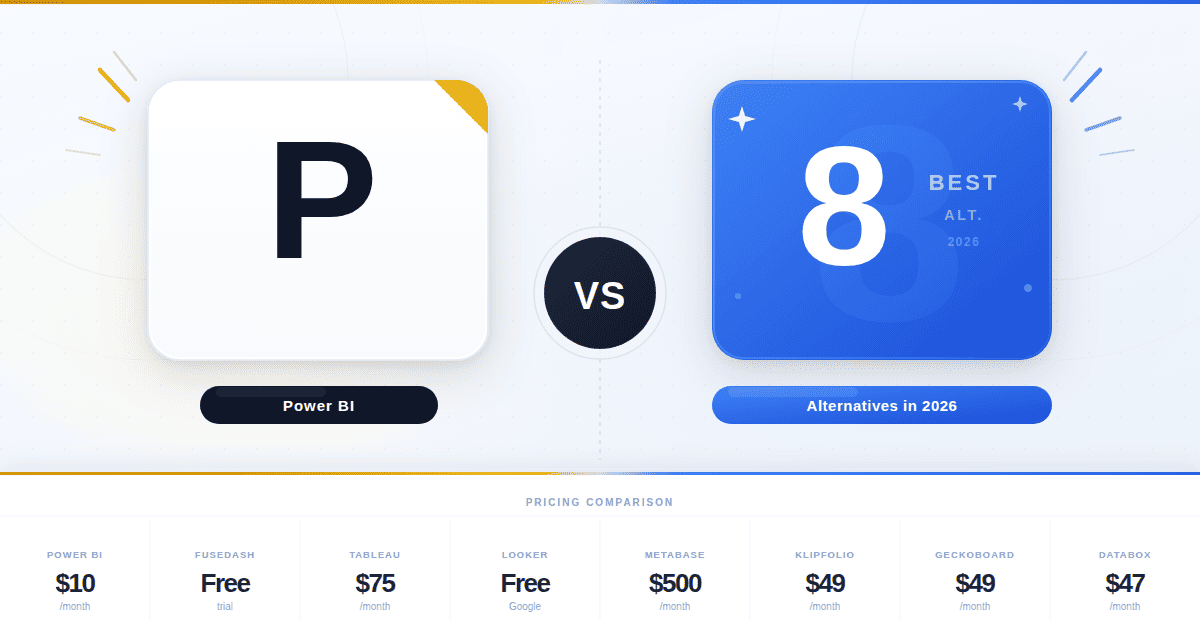
Power BI Alternatives: 8 Tools Worth Considering in 2026
Analytics
Read More

May 8, 2026
7 Best Klipfolio Alternatives in 2026: Pricing & AI Compared
Analytics
Read More

May 5, 2026
White-Label Client Reporting: A Setup Guide for Agencies (No Dev Required)
Reporting
Read More

April 30, 2026
AI Client Reporting Dashboards: An Honest Guide for Agencies in 2026
Dashboards
Reporting
Read More

April 27, 2026
Agency client dashboard: 7 templates that win renewals
Dashboards
Analytics
Read More
April 22, 2026
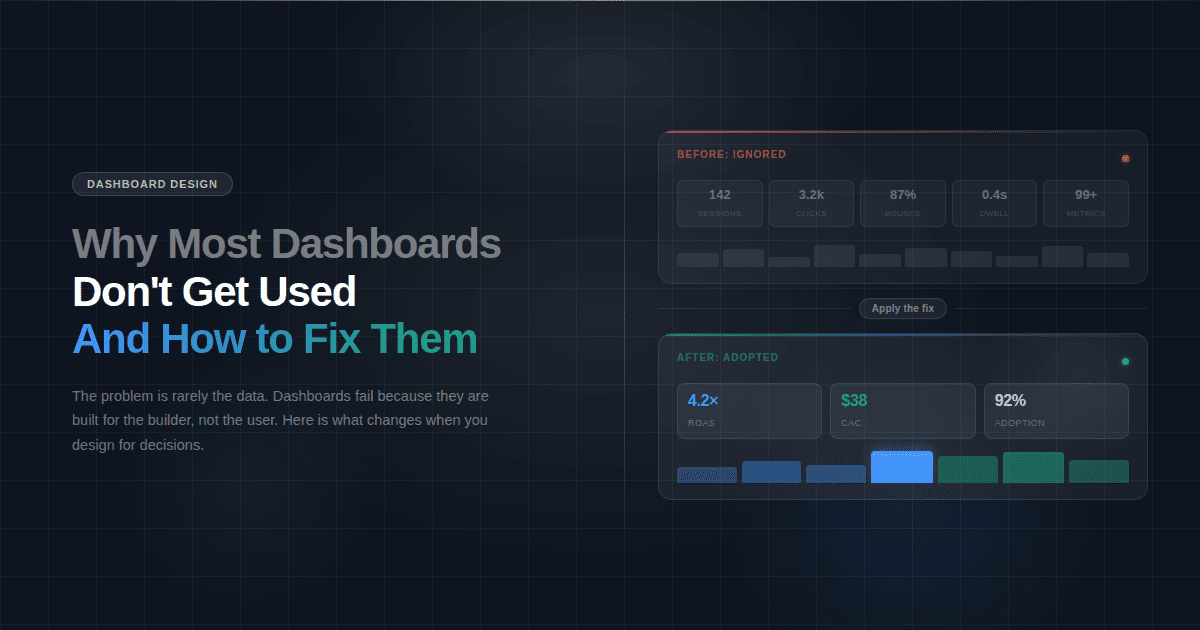
Why Most Dashboards Don't Get Used: And How to Fix Them
Dashboards
Read More
April 15, 2026
What Is Generative Analytics? Definition, Examples, and How It Works
Analytics
Read More