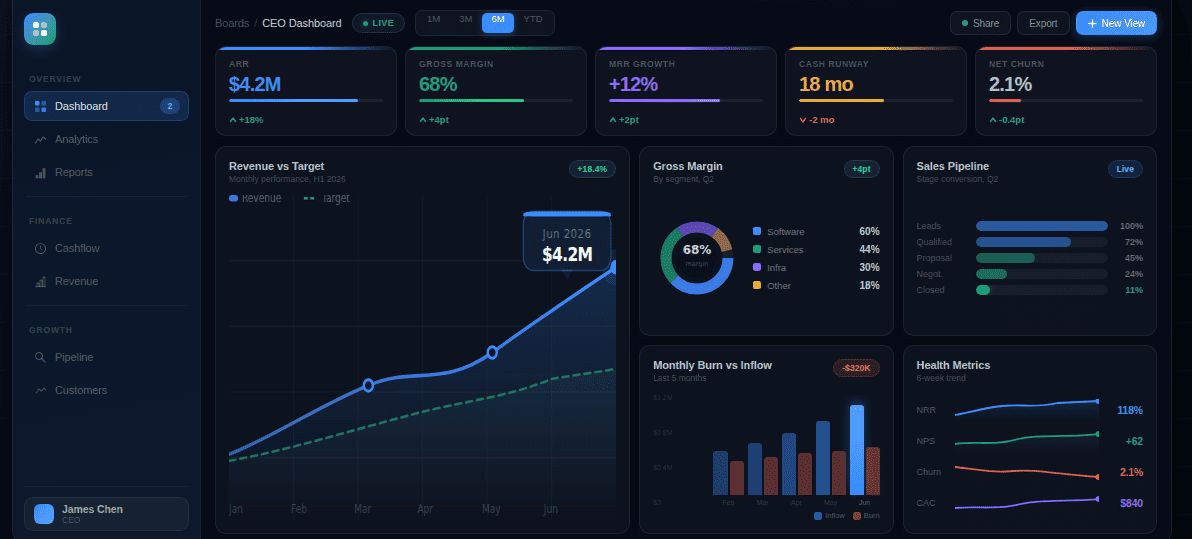
An agency client dashboard is the live reporting view an agency delivers to its clients to display campaign performance, govern KPI definitions across a retainer engagement, and reduce the monthly reporting overhead that erodes margin. Most agencies treat it as a deliverable. The renewal-grade ones treat it as a retention instrument, and the difference shows on the next QBR call.
This piece is for agencies delivering to external clients. In-house teams have a different problem.
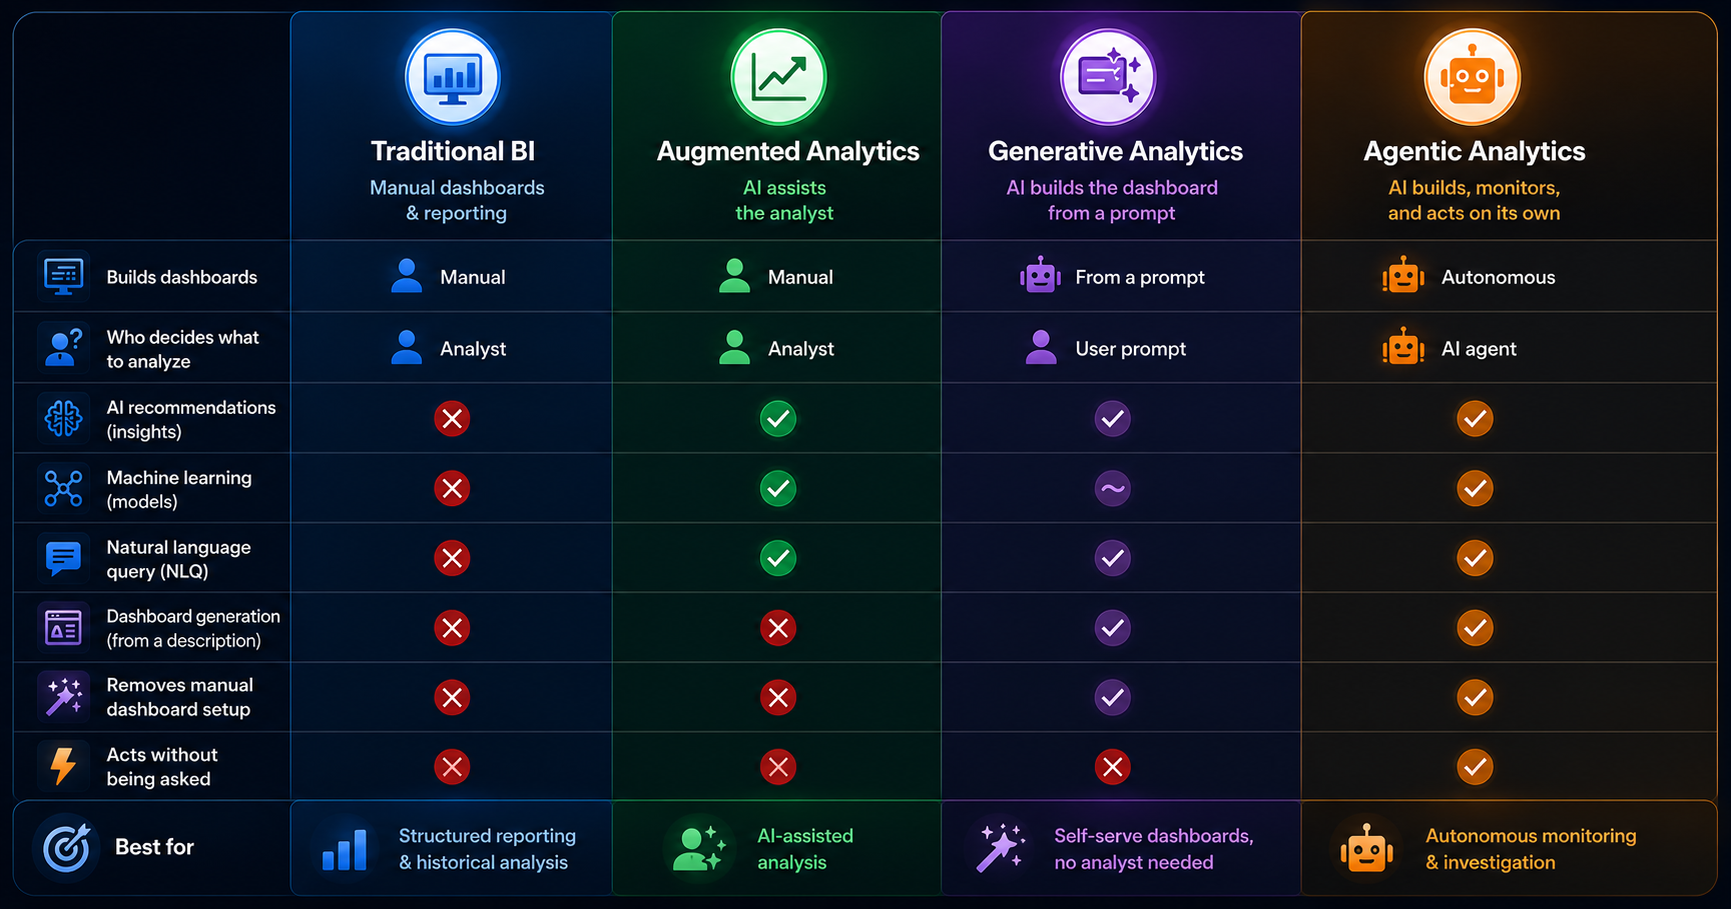
Why generic BI dashboards fail when agencies use them for client reporting
A BI dashboard rewards the analyst. The analyst wants drill paths, segmentation flexibility, and raw access to the metric layer. A client review dashboard rewards removal: one number that answers "did we hit the target," one chart that shows what moved, and a written line explaining why. Agencies retrofitting Looker Studio or Power BI into client deliverables almost always try to do both at once, and the result is a report that is comprehensive and unreadable. Clients quietly stop opening it.
Governance is the deeper failure. A BI dashboard with the metric layer exposed lets every stakeholder define "lead" or "conversion" their own way. On a single internal team that is recoverable. Across 14 retainer clients with three account managers each, it is not. The number debate that opens every QBR call originates here, and no amount of dashboard polish fixes it.
The Client-Ready Five: the three criteria most agency dashboards skip
A client-ready dashboard meets five criteria. Two are obvious. Clarity and branding are what every reporting platform sells as headline features, and every dashboard tool worth considering does them well enough out of the box. The other three are scope, cadence, and dispute-proofing, and they are what separates a renewal-grade dashboard from a generic one. The rest of this section covers the three that get skipped.
Scope is the dashboard explicitly stating what it does and does not measure. A PPC dashboard that shows Google Ads and Meta but silently excludes Microsoft Ads will produce a number debate the moment the client looks at their own credit card statement. State the date range, channels in scope, conversion definition, and attribution model on the dashboard itself. Without these, every drift between dashboard and reality becomes an accusation.
Cadence is the rhythm of delivery built into the operating model, not bolted on. Weekly pacing for paid media. Monthly for the executive view. Quarterly for the strategic deep-dive. Agencies that send the same view at every cadence are the ones whose clients ask "what changed since last week" and get a shrug.
Dispute-proof data means the dashboard names its source for every number, and that source is the same one the client uses to run their business. If the client books revenue in HubSpot and the dashboard reports leads from GA4, those two numbers will never agree. The agencies that survive disputes reconciled the source-of-truth question on day one. The agencies that did not spend every QBR call defending arithmetic instead of strategy.
How dashboards actually drive renewals
Three things happen when a dashboard is built right, and they compound into a renewal.
The first is margin recovery. Agencies that automate reporting reclaim hours per client per month, and those hours either go into strategy work the client values or back into agency capacity. The second is dispute de-personalization. When two stakeholders argue about a number, they are arguing with each other. When they argue with the dashboard, they are aligning against a common artefact, and that changes the temperature of every uncomfortable conversation. The third is between-QBR visibility. Most clients do not check the dashboard between meetings, but the few who do are usually the ones who quietly extend the retainer six months before it expires.
These three mechanisms are why renewal correlates with dashboard quality. Not because clients reward elegant reporting, but because they reward the operating discipline that elegant reporting reflects.
Template 1: Full-funnel marketing client dashboard
A full-funnel dashboard tracks the acquisition path from impression to revenue, blending paid, organic, email, and conversion data into one client-facing view that answers whether the agency is buying growth efficiently. Sometimes called a marketing agency dashboard when run across the full client roster, the same template appears under both names. It is the most universal template for multi-channel retainers and the one most commonly built badly.
The failure is treating it as an aggregator. Stacking every channel's metrics into a single screen produces a report that is comprehensive and unread. The renewal-grade version sequences the funnel: traffic at the top, leads or transactions in the middle, revenue or pipeline at the bottom, with channel breakdown as a drilldown rather than the headline.
KPIs at each stage are sessions, qualified sessions, leads, qualified leads, opportunities, and revenue. CAC, ROAS, and CPL belong on the same view as efficiency layers, not as headline numbers. Data sources span GA4, the ad platforms, the email tool, the CRM where leads land, and call tracking where the client uses it. The connection that matters most is from ad platform to CRM, because that closes the loop on revenue.
This template fails the Client-Ready Five most often on scope. Too many channels, too many definitions, too many ways for the client to find a number that does not match what they expected. State the conversion definition on the dashboard itself.
Best fit is ecommerce or B2B clients on retainers above $10,000 per month with multi-channel attribution in scope. Renewal lift comes from leading the QBR with funnel context instead of channel performance, which reframes the client's question from "what is each channel doing" to "what is the next constraint on growth."
Template 2: PPC client dashboard
The PPC dashboard wins or loses on attribution clarity. Spend, conversions, cost per acquisition, and return on ad spend across Google Ads, Meta, and any tertiary platforms in scope, refreshed daily or in real time. That is the easy part. The hard part is whose numbers count.
The pattern we see repeatedly looks like this. The dashboard reports 47 conversions for the month. The client's CRM reports 31. The agency knows why. The dashboard is counting GA4 form-fill events. The CRM is counting only sales-qualified opportunities. Both numbers are technically correct. Neither is the number the client actually cares about, and the next agency call is not about strategy. It is about whose numbers to trust. One of those calls per quarter is enough to put the renewal at risk.
The fix is naming the conversion source on the dashboard itself, in plain language, near the number. Not in a tooltip. Not in a footnote. On the screen. "Conversions, 47, source GA4 form-fill event. CRM-qualified opportunities, 31." Both numbers visible. The dispute moves from "your number is wrong" to "which number do we use to make decisions," and that is a question the agency answers, not defends.
Two metrics often left off should not be. Search impression share for Google search campaigns and creative-level CTR for Meta. These two surface the questions clients ask but rarely articulate clearly: are we missing volume, and is the creative tired.
Pair this template with a real-time data interface when spend justifies live pacing. Best fit is clients above $20,000 monthly paid spend on weekly pacing reviews. Renewal lift comes from the agency becoming the source of truth on spend and result, which removes the temptation for the client to second-guess every campaign through their own ad-platform login.
Template 3: SEO client dashboard
An SEO dashboard tracks rankings, traffic, and conversions, tied back to revenue when the data is connected. The template that fails stops at rankings. The template that wins connects ranking changes to traffic changes to outcomes.
KPIs that matter to clients are organic sessions, qualified organic sessions, conversions from organic, and revenue or pipeline value where attribution allows. Keyword rankings are a leading indicator, not a headline. Most clients do not care about position 4 versus position 3. They care whether the channel produced more business this quarter than last.
This template fails the Client-Ready Five most often on cadence. SEO data is monthly at best, and pretending it is weekly creates panic-signal patterns in months 4 through 9 of a contract when rankings naturally fluctuate. Set the cadence in the contract. Defend it in every QBR.
Data sources are Google Search Console, GA4, Semrush or Ahrefs, and ideally backlink data for long-tail retainers. Best fit is SEO retainers above $4,000 per month where the client expects monthly reporting tied to commercial outcomes.
Template 4: Social media client dashboard
The biggest call on this template is whether to include paid social or keep it on the PPC dashboard. The right answer is almost always to keep them separate. Mixing organic and paid social on one view sounds efficient and confuses the client every time. Organic rewards engagement. Paid rewards conversion. Putting both on the same screen trains the client to ask why organic does not convert at the same rate as paid, which is the wrong question and the conversation that breaks the retainer.
KPIs for organic social are reach, engagement rate, follower growth, and content performance by post type. Click-through to website matters as a secondary metric. Sentiment belongs on the dashboard for brand campaigns and not for performance social. Data sources are the native APIs for Meta, LinkedIn, TikTok, and X plus the website analytics tool to track downstream traffic.
This template fails the Client-Ready Five most often on scope, in a different way than the full-funnel dashboard. The scope failure here is silent platform inclusion. An agency reporting on "social media performance" while only pulling Instagram and Facebook will lose the renewal the first time the client asks why TikTok or LinkedIn is not in the numbers. State the platforms in scope on the dashboard, by name.
Best fit is brand-led clients above $3,000 monthly for organic social or above $8,000 monthly including content production. Renewal lift comes from showing the client which content types earn the most engagement and using that data to argue for next quarter's content investment.
Template 5: Lead generation client dashboard
A lead generation dashboard tracks the volume and quality of leads delivered to a B2B client, segmented by source and qualification stage, with MQL-to-SQL-to-opportunity conversion rates as the headline metrics. The template that fails treats every lead as equal. The template that wins makes the qualification funnel the centrepiece.
For B2B clients, total lead volume is a vanity metric. The numbers that matter are MQLs, SQLs, opportunities created, opportunities closed, and revenue attributed. Cost per MQL and cost per SQL belong alongside the volume figures, because the client's CFO will eventually ask whether the agency is buying 200 useless leads or 30 good ones. CAC payback period belongs on the dashboard for clients with longer sales cycles.
This template fails the Client-Ready Five most often on dispute-proofing. The CRM is the source of truth for qualification, the agency rarely owns the CRM data, and lead-status definitions tend to drift. Reconcile them with the client's revenue team in the contract or watch the renewal call become a debate about lead quality.
Data sources span the ad platforms, the CRM, and the marketing automation platform when it sits between. Best fit is B2B SaaS, professional services, and enterprise sales clients with retainers above $7,000 per month. Renewal lift comes from shifting the conversation from lead count to pipeline value, which is what the client's revenue leadership reports on internally regardless of what the agency sends them.
Template 6: Multi-client portfolio dashboard
This template is not a client deliverable. It is the agency reporting dashboard run internally across every retainer, showing performance, pacing, and risk indicators for the entire client roster on one screen, refreshed daily and reviewed weekly by account leadership. It is what separates agencies that scale past 15 retainers from agencies that hit a ceiling and stop.
The pattern that justifies this template looks like this. An agency reaches its eleventh retainer client and the head of account discovers, on opening the portfolio view one Monday morning, that their highest-margin account has had no senior contact for 47 days. The pacing was on track. The KPIs were green. Communication had quietly gone cold during a busy quarter on another account. The portfolio dashboard surfaces the contact gap before the dashboard's KPI alerts would have fired, and a QBR gets scheduled the same week. The retainer renews two months later. Without the portfolio view, the renewal call would have been the first substantive conversation in seven weeks. That is how clients churn green.
KPIs are spend pacing versus contracted budget, performance versus contracted KPIs, days since last client communication, days until next QBR, and renewal date proximity. Underdelivery against contracted KPIs is the leading indicator of churn. Communication gap is the second.
Data sources span every client account on the same connectors used for individual client dashboards, plus the agency's CRM where retainer terms live. The technical decision that determines whether the portfolio view actually works is whether the underlying KPI definitions are standardised across every client. Best fit is agencies above 8 active retainer clients.
Template 7: Retainer retention dashboard
The retention dashboard is the one most agencies should build and almost no agencies do. It tracks signals that predict churn before underperformance shows up in campaign KPIs, and it indicates which clients need a strategic conversation before the renewal call arrives. For a service business operating at scale, it is the closest thing to a competitive advantage available.
KPIs are not campaign metrics. They are relationship metrics. Months on retainer. Scope-creep dollar value. Call frequency over the last 90 days. NPS or CSAT score where collected. Days since the last positive client message. Whether the primary client contact has changed during the contract period. That last one is the most predictive signal in the entire dashboard. Agencies lose clients after a contact change far more often than after underperformance, and most agencies do not catch the change until the renewal conversation is already in trouble.
Here is what the operating model looks like when the dashboard works. The retention view flags a contact change at a flagship client. The agency lead schedules a relationship-building call within two weeks rather than waiting for the next QBR. The new contact gets brought into the operating cadence, briefed on the retainer history, and given a deliverable they can take internally and credit-share. By the time the renewal proposal lands, the new contact has already approved three pieces of work. The renewal is a formality. Without the dashboard, the new contact meets the agency for the first time on the renewal call, and the agency is selling against a stranger.
The dashboard is harder to build than any client-facing template because the data is fragmented across internal tools: the CRM, the project management system, email and Slack archives, any survey tool used for NPS or CSAT. But the agencies that build it run renewal forecasting against it instead of against last quarter's revenue, and that is the operating shift this template enables.
This is the one template that does not fit the Client-Ready Five framework, because it is internal and has no client view. The criteria that matter for it are different: data integration depth, signal sensitivity, and a defined response protocol for each signal type. Without the response protocol, the dashboard is just a churn-prediction widget that nobody acts on.
Best fit is agencies above $2 million in annual retainer revenue where churn cost dominates new-business cost. The retention payoff is the entire purpose of the template, and the reason it appears last on this list is that it is the one most agencies have not built yet.
How to choose the right template by client type
The seven templates are not all relevant to every agency. Choose based on client profile, retainer scope, and reporting cadence. The matrix below pairs each common client profile with the template most likely to anchor the renewal conversation, and the secondary template that should sit one click behind it.
For multi-discipline retainers, full-funnel headlines with channel-specific drilldowns one click behind. For agencies above eight retainers, the multi-client portfolio view belongs in the operating stack regardless of client mix.
What this means for your agency
The opening claim of this article was that dashboards win or lose renewals because of what conversation they enable on the next QBR call. The seven templates above are the operating shapes that conversation can take. The platform decision is the last decision in the chain, and the question to ask of any platform is whether it supports the agency operating model or fights it. These are not abstract client dashboard examples. They are the operating layer of a service business. The Fusedash client reporting dashboard was built for this operating model.