The phrase "AI-powered" is now in almost every reporting tool's marketing copy, and the actual capability behind it varies wildly. Some platforms have plugged a chat input into a templated dashboard and called it AI. Others genuinely generate the layout from a description, refresh it live, and let clients ask questions of their own data. The gap between those two is the difference between a marketing label and a workflow change.
This guide is for agency owners and operations leads who want a clear-eyed view before they take a demo. We cover what AI client reporting dashboards genuinely change about agency reporting, where they still fall short, the questions to ask before you sign, and the math that tells you whether AI-first reporting actually pays for itself at your client count.
An AI client reporting dashboard, in plain terms, is a live, interactive analytics view that an agency builds by describing what it needs in plain language. The AI generates the layout, charts, and KPI cards from connected data, and clients access the agency reporting dashboard through a shareable link rather than waiting for a monthly PDF. It replaces the chart-rebuilding cycle, not the strategic narrative.
What AI Actually Does in Client Reporting (And What It Doesn't)
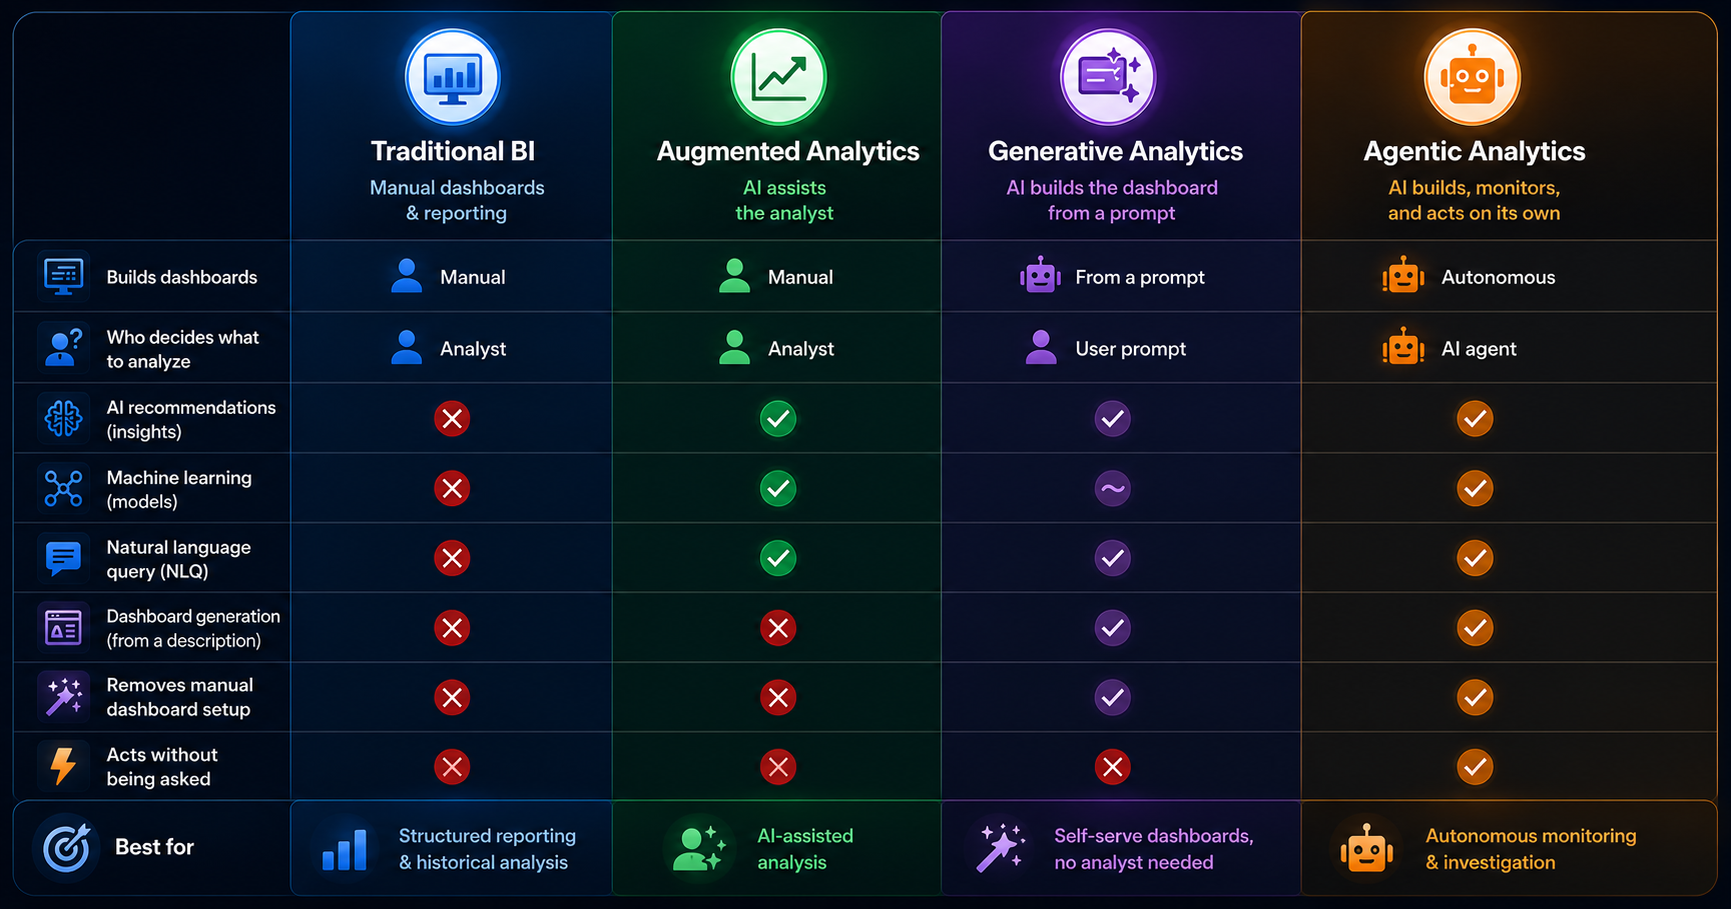
Most AI dashboard claims collapse two different capabilities into one phrase: AI that generates dashboards from a description, and AI that adds insights on top of an existing dashboard. They're not the same thing. Both exist, both are useful, but only the first changes what an agency's reporting workflow looks like day-to-day.
What AI handles well today
Generating the dashboard from a description. Tell the system "show this client's Google Ads performance with conversion-by-campaign, monthly spend pacing, and top creatives," and the layout comes back built. KPI cards, breakdown tables, the right chart types for the right questions. What used to take an account manager 60 to 90 minutes of widget-dragging becomes a five-minute brief plus a refinement pass. This is the part of AI data visualization for agencies that genuinely shifts the unit economics of a retainer.
Live data refresh without rebuild. Once the AI-generated client dashboard is built, it stays current. New campaign data lands, the dashboard reflects it. The agency stops rebuilding the same view every month and instead adjusts the narrative around live numbers. For agencies running 15 or more active retainers, the cumulative time saved on automated client reporting outweighs the dashboard generation itself.
Letting clients ask follow-up questions of their own data. This is the newer capability, and the one most agencies haven't internalized yet. A client looks at the dashboard, notices conversions dropped in week three, types "what changed in week three?" into a chat input, and gets a direct answer pulled from their connected data. The account manager isn't in the loop for the first question, only for the strategic interpretation that follows. This single feature does more to reduce inbound "quick question" emails than any reporting cadence change.
What AI doesn't replace yet
The strategic narrative. AI can flag that conversions dropped in week three. It can't tell the client whether that's because of the algorithm update, the creative refresh, or the seasonality pattern that hits them every Q4. The narrative the account manager writes ("here's what happened, here's why, here's what we're doing about it") is still the work. Agencies that pitch AI as a replacement for that narrative are mispricing themselves.
True white-label with custom domains. Most AI-first dashboard platforms don't yet support full white-label setup the way AgencyAnalytics or Whatagraph do: custom domains, branded login pages, removed vendor logos. The platforms that own that space are template-based, not AI-generative. If your client deliverable depends on the dashboard appearing on reports.youragency.com with no third-party branding visible, AI dashboards are not the right primary tool today. They might be the right secondary tool (a live working view that pairs with a white-label PDF), but they're not yet a one-stop replacement.
The QBR deck. Quarterly business reviews live in slides. They get presented in a meeting. They include strategy sections, account-team commentary, next-quarter plans. AI dashboards don't produce this output and shouldn't try. The mistake some agencies make is forcing the dashboard into the QBR slot, which works for the data section and breaks for everything else.
That's the full scope. AI dashboards genuinely change the day-to-day reporting workflow. They don't change the strategic deliverables an agency builds for senior client stakeholders.
When an AI Client Reporting Dashboard Fits (And When It Doesn't)
Three variables determine fit. Walk through them in order. If the client doesn't pass all three, an AI agency dashboard is over-investment.
1. Client check-in cadence. Does this client log in between monthly reports, or only read what you send? If they're a check-in-weekly type (DTC ecommerce, performance brands, founder-led startups), a live client dashboard is genuinely useful and will get used. If they read the monthly PDF and ignore everything else (which describes most B2B retainers), a live dashboard is overhead they won't touch. Build the PDF properly, skip the dashboard for that client.
2. Data source complexity. Are you reporting on one channel, or blending multiple? Single-channel reports (PPC-only, SEO-only) work fine in templated tools. The AI generation advantage is marginal. Cross-channel blending is where an AI marketing reporting dashboard earns its cost. Describing the dashboard you want is faster than building the joins, calculated metrics, and unified date filters by hand. The friction lives in the metric reconciliation, not the chart layout, and AI removes most of it.
3. Retainer tier. A live, interactive dashboard reads as a premium reporting layer to most clients. That perception only matters if the client is paying enough to value it. For sub-$3K monthly retainers, a clean PDF is usually the right deliverable and a live dashboard is over-investment. For $5K-plus retainers, especially where the client compares your reporting to in-house analytics teams or to other agencies, the live dashboard becomes a retention asset.
The decision is roughly: live cadence + multi-channel + premium retainer = AI dashboard fits. Any of those three missing, and the value drops fast.
The reframe most vendor pitches miss: most agencies don't need AI to generate dashboards. They need AI to keep dashboards current without manual work. That's the actual value. It's a smaller value proposition than the marketing suggests, but it's real, and worth the budget when the fit is there.
The Five-Step AI Dashboard Workflow
This is the operational sequence that replaces the manual chart-rebuilding cycle. The same five steps apply regardless of which AI-first platform you pick.
Step 1: Connect the data sources in the right order. The connector layer is where most rollouts quietly break in week two. Three rules from agencies who've done this at scale: connect Google Ads first because its API throttles most often and you'll find the rate-limit edge cases before they bite during a client deadline. Connect GA4 second and immediately reconcile the conversion definitions against what's in your ad platforms. Attribution mismatch between GA4 and Google Ads is the most common reason client numbers don't match later. Save Search Console for last; it backfills slowly and has a 16-month lookback ceiling on query data that catches agencies off guard if they haven't worked with it before. The platform handles auth and pulls data on a schedule, but how you sequence the connections decides whether the first dashboard you show a client matches their internal numbers or starts a reconciliation conversation you didn't budget time for.
Step 2: Describe the dashboard you need. Not click-by-click building. A useful brief reads like this: "show paid search ROAS by campaign for the last 90 days excluding the November Black Friday window, weekly spend pacing against $40K monthly with overspend flagged in red, top 10 keywords by conversion volume limited to keywords with at least 50 clicks, and a creative-level breakdown for campaigns that drove more than 5% of total conversions." The AI builds the layout. The reason this version of the brief works better than the generic "show campaign performance" version is that it names the operational specifics (the seasonality exclusion, the threshold flags, the volume floors) that an experienced account manager would add by hand anyway. The brief becomes the spec, and the spec becomes the dashboard.
Step 3: Refine and add the agency layer. The first generation is a starting draft. The "agency layer" is the work that turns a generic AI-built dashboard into a client-ready one, and it's specific:
- Calculated metrics that the platforms don't ship by default. Blended ROAS across channels, cost per qualified lead (not just MQL), contribution margin after fulfillment, customer acquisition cost adjusted for assisted conversions. These are the numbers the client actually cares about, and they don't exist in any single ad platform.
- Comparison contexts. Versus last month, versus same month last year, versus the budget target, versus the Q-over-Q trend. A KPI without comparison is a number. A KPI with comparison is a decision input.
- A metric definitions document that lives next to the dashboard. Two account managers will name the same KPI three different ways across clients unless there's a single source of truth for what "ROAS", "qualified lead", and "engaged session" mean at your agency. Without it, you get metric drift between clients and a slow-burn credibility problem when a client asks why their ROAS is calculated differently from their friend's agency report.
- Annotations that anchor the client's mental model. For some clients the headline is ROAS. For others, it's revenue. For others, it's qualified leads. Anchor the dashboard around the metric the client thinks about first, then layer the supporting view underneath. Match the chart types to the questions the client actually asks.
This step is what separates a generic dashboard from a deliverable. It's also the part AI doesn't help with yet. The agency layer is judgment work.
Step 4: Set the refresh cadence and access. Daily refresh for active campaigns, weekly for slower-moving channels, real-time for clients who run live operations. Generate the shareable link for the live client dashboard. If the platform supports a chat input on the dashboard, enable it so the client can ask follow-up questions without an account-manager round trip. Pay attention to lookback overlap: if your refresh window is 24 hours but conversion lag on the channel is three days, the most recent numbers in your live dashboard will revise over the following week. Build that into the client conversation up front rather than explaining it after a client emails about "the numbers changing."
Step 5: Pair the dashboard with the monthly PDF or QBR. This is the step most agencies skip. The live dashboard is for the minority of clients who check in between reports. Most clients still read the monthly PDF and ignore the live view. Your own client base may differ, so survey before assuming. The AI-first automated client reporting dashboard replaces the chart-rebuilding inside the PDF, not the PDF itself. Build the PDF as a structured data story around the live numbers, send it on the agreed cadence, link to the live dashboard for clients who want to dig deeper.
The diagnostic line worth keeping: if your reporting workflow doesn't break at scale, you don't need an AI dashboard. If it does, you don't need a better template. You need a different system.
The Common Pitfalls (And How They Show Up)
Five failure patterns that come up repeatedly in agency rollouts of AI client reporting dashboards. Each one is a specific operational problem, not a vague warning.
Pitfall 1: Treating the dashboard as a replacement for the monthly call. The dashboard is infrastructure. The monthly call is interpretation. Agencies that cut the call after rolling out a live dashboard tend to see retention soften over time. Clients confuse "I have access to the data" with "the agency is engaged with my account." The data view is necessary but not sufficient.
Pitfall 2: Skipping the dashboard tour during client onboarding. If the account manager doesn't walk the client through the dashboard in the first 30 days, adoption drops near zero and the dashboard becomes an unused asset that the client mentions in renewal conversations as something they didn't get value from. The fix is a 20-minute structured tour in onboarding week two: here are the headline KPIs, here's where to filter, here's the chat input, here's what to ask, here's the email I get if you have a question that the dashboard can't answer.
Pitfall 3: Metric definition drift between account managers. AM #1 builds a client dashboard where "ROAS" uses last-click attribution. AM #2 builds a different client dashboard where "ROAS" uses data-driven attribution. Both are valid. Neither is consistent. When a CMO compares notes between two of your clients at an industry conference, the credibility cost is real and you won't see it coming. The metric definitions document mentioned in Step 3 is the only durable fix.
Pitfall 4: Connector failures that go unnoticed until the client asks. A Meta connector drops auth on a Saturday. The dashboard shows the last good data through Monday morning. Nobody on the agency side notices. The client sees it Tuesday. The fix is alerting infrastructure: any connector that hasn't refreshed in 48 hours triggers an internal email before the client sees stale numbers. Most platforms have this built in. It just has to be turned on.
Pitfall 5: Confusing branded reports with branded dashboards. A client asks for "white-label reporting." The agency demos a logo'd PDF and a logo'd dashboard. The client signs. Three weeks in, the client realizes the dashboard URL still has the vendor's domain in it and the login page shows the vendor's logo. That is the conversation that turns into a churn risk. If white-label custom domain is the deliverable, ask the platform on day zero. Most AI-first dashboards don't support it yet, and pretending otherwise is the failure pattern that costs the most.
The Math: When AI-First Reporting Pays For Itself
Pricing pages obscure this calculation. The actual numbers are roughly:
Take an account manager at $75/hour fully loaded. Manual dashboard build and refresh cycles run 75 to 90 minutes per client per month, which is 12 to 15 hours monthly for a 10-client book. That's $900 to $1,125 per AM per month, $10,800 to $13,500 per year, in pure dashboard-rebuild labor.
AI-first reporting cuts the per-client time to roughly 20 minutes monthly after the initial build, a 70% to 75% reduction. New annual labor cost: $3,000 to $3,750 per AM. Annual labor savings: roughly $7,000 to $10,000 per AM with a 10-client book.
A typical AI-capable platform runs $200 to $500 monthly at this scale, or $2,400 to $6,000 annually. Net savings per AM: $1,000 to $7,600 per year on a 10-client book, scaling roughly linearly with client count.
Two caveats. The first is that AM time freed up has to actually go somewhere productive (strategy, client expansion, new business) or the savings are theoretical. Most agencies underestimate the discipline this requires. The second is that if your bottleneck is account-manager judgment rather than chart-building, the platform won't help. AI dashboards replace mechanical work. They don't replace thinking.
The Looker Studio question
Looker Studio is the elephant in this category. It's free, ships with native Google integrations, and is the default fallback for any agency that doesn't want to pay for a dashboard tool. Not addressing it would be a gap.
What Looker Studio does well: free at every scale, deep integration with the Google data ecosystem, reasonable for single-client work, established and stable. What it doesn't do: AI-generated layouts (you build every dashboard manually), chat-with-data capability, scheduled white-label PDFs without bolted-on workarounds, multi-client management at scale (separate report per client, no central agency view). For a solo consultant or a two-client side project, Looker Studio is genuinely the right answer. For a 10-plus-client agency rebuilding similar dashboards every month, the manual-rebuild cost is the same problem AI-first dashboards exist to solve.
The takeaway: AI dashboards subtract a real, measurable chunk of operational time. They don't subtract the work that makes an agency worth paying for.
Five Questions to Ask Before You Sign
These are the buyer-protection questions almost no vendor article covers, because honest answers don't always favor the vendor. Ask them in any demo for an AI analytics dashboard for agencies before signing.
1. What happens to my dashboards if I cancel the subscription? Do they archive in read-only mode for a grace period, get exported as PDF, or simply disappear? The answer determines whether your client switching cost is psychological (we like this dashboard) or technical (we cannot leave without losing reporting infrastructure).
2. Where does the data physically sit, and who has access? Specifically: cloud region, sub-processor list, encryption at rest and in transit, and whether the vendor's support team can see client data when responding to tickets. Several enterprise clients require this answer in writing before the agency can connect their data.
3. Can I export the data and rebuild the dashboards elsewhere if I switch tools? Many platforms make data extraction technically possible but operationally painful: CSV-only exports, no schema documentation, no API for bulk pull. Test this in the trial, not after migration.
4. How does pricing scale when I go from 10 clients to 50? Per-seat, per-client, per-data-source, per-event, or flat-tier? Pricing models that look reasonable at 10 clients can become punitive at 30. Ask for the price quote at three points (current scale, 2x current, 4x current) and watch for the discontinuity.
5. What's the support response time when a connector breaks at month-end? This is the operational question that separates platforms that work in steady state from platforms that work in steady state but fail when you actually need them. Ask for the support SLA in writing, and ask whether weekend connector failures get same-day response.
If your reporting workflow is breaking at scale and you're looking for a system change rather than another template, the Fusedash client reporting dashboard is built for the AI-first workflow above: natural-language dashboard generation, live shareable links, and a chat input that lets clients ask follow-up questions of their own data. Book a 20-minute walkthrough on a real client account. You'll know within the first generation whether the workflow change is real for your agency or whether your current setup is already good enough.