Augmented analytics is business intelligence that uses AI and machine learning to automate the grunt work of analysis, including data preparation, insight discovery, and plain-language querying, so people reach answers without building every step by hand. Gartner named the category in 2017, and the twist in 2026 is that it barely exists as a separate market anymore, because every major BI vendor absorbed those features into the base product.
What augmented analytics actually is
Augmented analytics uses machine learning, natural language processing, and AI to automate data preparation, surface insights, and explain them inside a BI platform. Gartner's IT glossary, which coined the term in 2017, defines it as technology that augments how people explore and analyze data, and it is deliberate about one thing: the human still makes the call.
Strip away the marketing and augmented analytics is a bundle of features bolted onto an ordinary BI tool. The analyst still runs the show, and the AI clears the busywork between a question and its answer by automating four things:
- Data preparation. It cleans and profiles incoming data so it is ready to use.
- Insight discovery. It scans for the patterns and outliers a busy analyst would miss.
- Natural-language query. It answers questions typed in plain English.
- Chart suggestion. It recommends the visualization that fits the question.
The word that carries the weight is augment. These tools speed up the analyst, they do not replace the analyst, and Gartner drew that line on purpose. Ask a question, get a suggested answer, decide whether to trust it. That loop keeps a human accountable for the number, which is why finance departments and regulated teams adopted augmented analytics faster than they adopted anything fully automated.
How analytics got here: 2017 to 2026
The path from augmented analytics to generative analytics runs through five years of steady AI additions to business intelligence. Gartner named augmented analytics in 2017, natural-language query went mainstream by 2021, large language models reached BI in 2023, copilots spread across nearly every platform in 2024, and agentic and generative capabilities landed in 2025 and 2026.
Why "augmented analytics" quietly stopped being a category
Augmented analytics has largely dissolved as a standalone market because the features that defined it became standard equipment. Natural-language query, automated insights, and anomaly alerts now ship inside Power BI, Tableau, Qlik, and Looker by default. Gartner itself folded the label into its broader Analytics and Business Intelligence Platforms coverage, treating augmented capabilities as table stakes rather than a separate thing to buy.
This was predictable, and some analysts called it early. InformationWeek's read on the analytics and BI market argued that generative AI would be a temporary differentiator before turning into a commodity, the same way dashboards and predictive analytics did. Two years on, that is roughly what happened. The AI layer converged, and the demos across vendors started to look interchangeable.
For a buyer, the takeaway is blunt. In 2026, shopping for an augmented analytics platform mostly means shopping for a BI platform and then checking that its AI features actually work on your data. The real differentiator slid underneath the AI, back to the data model, the governance, the pricing, and the ecosystem you already run. The chat box is not the decision anymore. What sits behind it is.
Augmented analytics vs generative analytics vs traditional BI
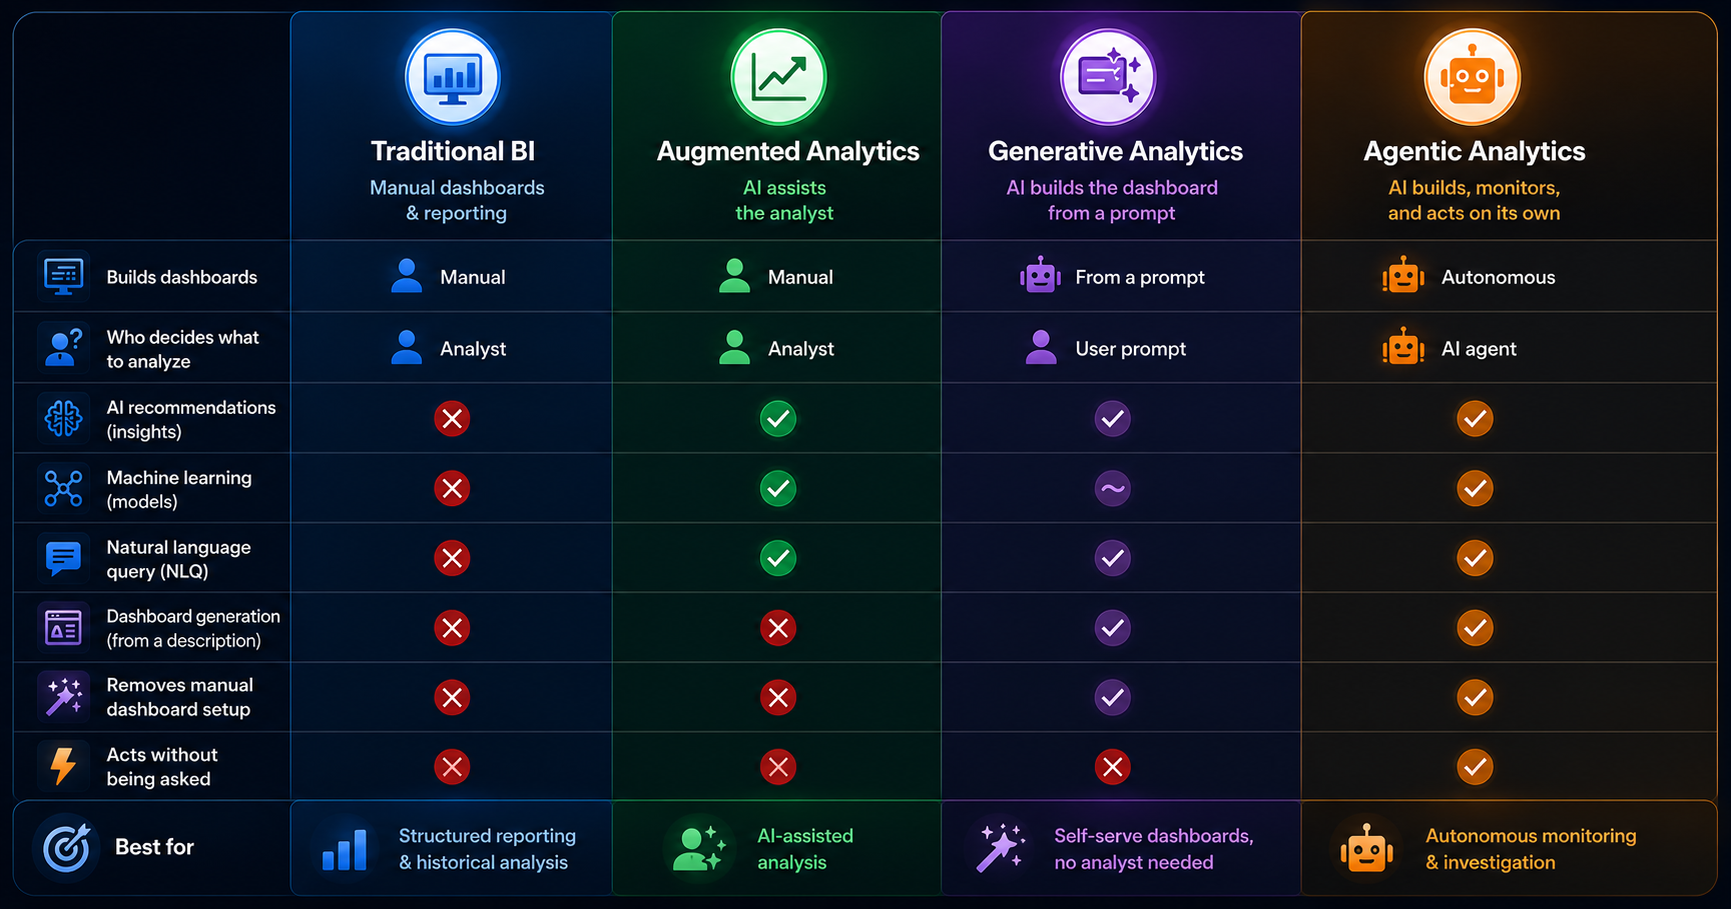
Traditional BI, augmented analytics, and generative analytics differ by who does the building. Traditional BI hands the whole job to a person wiring up charts by hand. Augmented analytics keeps that person in charge but uses AI to automate prep, insights, and queries. Generative analytics drops the manual build entirely and generates the dashboard straight from a plain-language description.
Vendors muddy these lines constantly. Some call the next step AI-native or conversational analytics, others slap agentic on the same features, and the words get sold before they get defined. The distinction that survives the marketing is the starting point. Augmented analytics starts from a dashboard somebody already built and makes it smarter. Generative analytics starts from a sentence and builds the dashboard for you.
Generative BI is one more label worth untangling. It usually means a natural-language box stapled onto a traditional tool that answers one question with one chart. Useful, but narrow. A generative analytics platform produces the whole persistent workspace a team monitors day to day, not a single answer to a single question, which is the difference between a feature and a category.
Where agentic analytics fits in 2026
Agentic analytics is the 2026 term for BI tools that do not only answer questions but take steps on their own, investigating data, testing a hypothesis, and returning findings without a person driving each click. ThoughtSpot now brands itself an agentic analytics platform, and Tableau, Power BI, and Qlik have all shipped agent features. It is the next layer of automation, not a replacement for the models beneath it.
Agentic sits on top of augmented and generative analytics rather than beside them. An agent still needs somewhere to act, whether that is a configured BI environment or a generated one. The clean way to hold the vocabulary is this: agentic describes autonomy, augmented describes assistance, and generative describes where the interface comes from. They answer different questions, and one product can honestly claim all three.
Why generative analytics is possible now
Generative analytics became practical in 2026 because five foundational technologies matured at the same time. None of them was new on its own. The shift was that large language models, semantic layers, vector search, large context windows, and cheap inference all became good enough together to build a dashboard from a sentence.
Here is what each piece contributes:
- LLM reasoning. Models that interpret a request and map it to data, not just generate text.
- Semantic layers. Governed metric definitions the model maps to, so revenue means revenue.
- Vector search. Retrieval that pulls the right fields and context for the request.
- Large context windows. Enough room to hold a real schema in a single prompt.
- Cheap inference. Low enough cost to generate a full dashboard on demand.
The order they arrived in mattered. Language models could write fluent text for years, but without a semantic layer they guessed at what a metric like revenue meant and got it wrong. Cheap inference did not help while context windows were too small to hold a schema. The category waited on its slowest input, affordable inference at scale, which landed in 2025.
Open standards did the rest. The Model Context Protocol made it practical to connect data sources without hand-building a separate connector for each one, so a platform could read a schema, map a plain-language description to real fields, and generate a working dashboard. That plumbing sits under every generative analytics platform, and it did not exist at this quality even three years ago.
What augmented analytics looks like in practice
Augmented analytics examples are easiest to see in the big BI platforms that layered AI onto existing products, from ThoughtSpot to Power BI to Qlik to Tableau. Each one adds AI on top of dashboards a person already built, sharpening a configured environment instead of generating a new one. Four make the pattern clear:
- ThoughtSpot. Answers typed questions and flags anomalies on its Liveboards.
- Power BI Copilot. Writes DAX and summarizes reports inside Microsoft's stack.
- Qlik. Surfaces automated insights through its associative engine.
- Tableau Pulse. Pushes metric changes and alerts out to users.
The common thread is that the data model comes first. Somebody connects the sources, defines the metrics, and builds the semantic layer, and only then do the AI features have anything to act on. That order never changes with augmented analytics tools. It is why an AI dashboard built on one of these platforms still assumes a configured foundation sitting under the natural-language layer.
That foundation is also where the real cost hides. Power BI's Copilot is genuinely useful, but it assumes a modeled dataset and someone fluent in DAX to maintain it. Qlik assumes its associative engine. The AI features feel nearly free once you are inside the ecosystem, and expensive to reach if you are not, because the modeling work they depend on has not gone anywhere.
The limits of augmented analytics, and the shift toward generative
The ceiling on augmented analytics is that it speeds up a workflow without removing its bottleneck. Somebody still configures the dashboard, models the data, and maintains the templates before the AI can help. When the backlog comes from that configuration work itself, augmenting the tool makes each step quicker but leaves every step in place.
That gap is what generative analytics goes after. Instead of assisting the person who configures the view, a generative analytics platform generates the view from a description and rebuilds it when the description changes. The configuration step is not accelerated, it is removed. For teams whose real constraint is analyst capacity rather than analyst speed, that is a categorically different fix.
None of this makes augmented analytics the loser. A company with a mature data model and analysts who need to move faster inside a governed BI environment is exactly who the augmented model serves, and the major platforms serve it well. The choice comes down to one question: is your team slowed by how fast analysts work, or by how few dashboards they can build?
Augmented analytics, generative analytics, and the agentic label stacked on top all answer different questions about where AI belongs in the stack. One makes a configured environment faster, one builds the environment from a description, and one lets it act on its own. Map each to the bottleneck it actually removes, and the buzzwords stop mattering.