Microsoft's April 2025 Power BI price increase changed something the rest of the BI industry has not fully metabolized. Per-user costs went up 40 percent. Premium capacity moved exclusively to Fabric F-SKUs. The Copilot AI features got walled off behind capacity tiers. Three years ago, "leave Power BI" was a niche conversation. In 2026 it is a quarterly board agenda item.
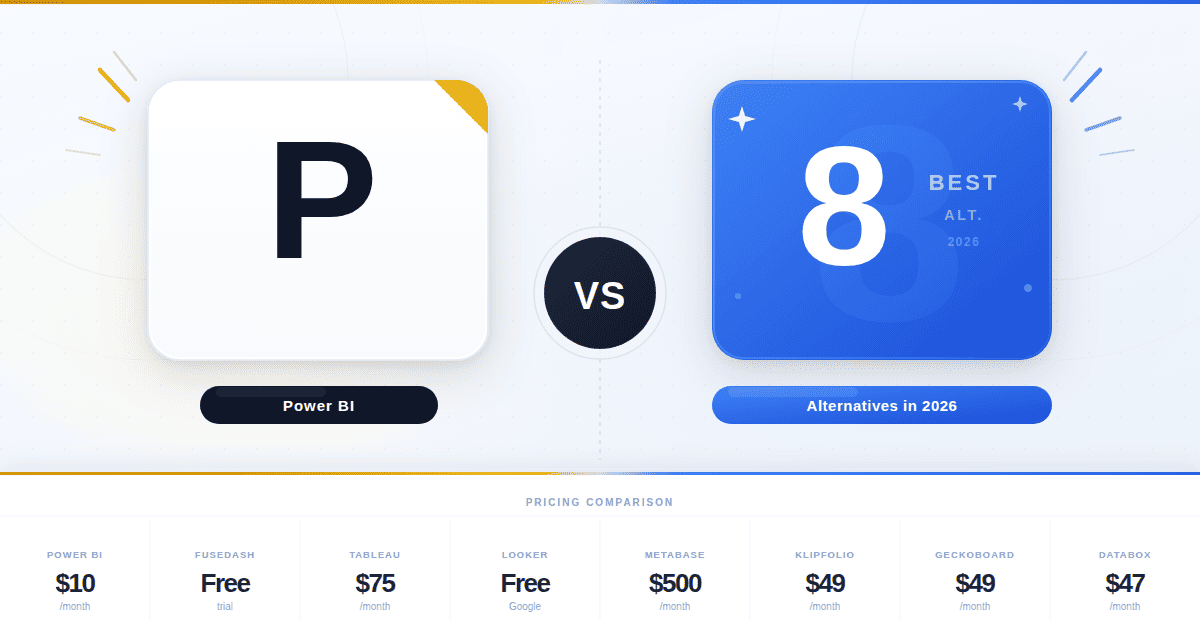
The strongest Power BI alternatives this year are Tableau (enterprise visualization), Looker (governed semantic modeling), Sisense (embedded analytics), Qlik Sense (associative exploration), ThoughtSpot (AI-native search), Domo (end-to-end consolidation), Metabase (cost-constrained teams), and Fusedash (AI-native dashboard building). The right choice depends less on dashboard features than on the architectural pain point driving the move: Fabric capacity math, the DAX learning curve, semantic-layer fragmentation, or Power BI Embedded multi-tenant friction.
Before that comparison, one point most articles skip. Power BI is good. It dominates the Microsoft-centric enterprise for reasons that hold up under scrutiny. Excel integration is seamless, Azure connectivity is native, and at $14 per user per month for Pro it remains the cheapest entry point in enterprise BI. The labor market for Power BI analysts is the deepest in the category, which means hiring is the cheapest too. None of the alternatives below match that profile. Pretending otherwise undermines the comparison before it starts.
What this guide covers, with verified May 2026 pricing throughout: eight platforms organized by the buyer archetype that drives the decision, the architectural problem each one solves, where each one is weaker than Power BI, and a migration section with DAX translation examples that most comparisons skip.
Why teams are leaving Power BI in 2026
The case for switching looks different than it did three years ago, because Power BI itself looks different.
Fabric pricing rewrote the math. Microsoft raised Power BI Pro from $10 to $14 and Premium Per User from $20 to $24 on April 1, 2025. The P-SKU Premium capacity at $4,995 per month (P1) was discontinued for new customers in July 2024. Fabric F-SKUs are now the only path for capacity-based deployments. F2 starts around $263 per month for development workloads. Production embedded deployments typically need F64 at roughly $5,068 per month or larger to unlock viewer access without per-user licensing. Many teams budgeted against the old P1 numbers and are recalibrating fast.
Copilot is behind a paywall. Power BI Copilot, the natural-language and AI-summary feature Microsoft marketed heavily through 2025, requires Fabric F64 or higher, or PPU on a paid capacity. Standard Pro users do not get it. Teams who wanted to ask questions of their data without committing to capacity infrastructure are looking elsewhere, often at tools where AI features are part of the base product rather than a premium tier.
DAX is a hiring constraint. The syntax handles complex calculations well, but it is unfamiliar to SQL users and impenetrable to most business users. In larger deployments two or three analysts who actually understand DAX become the bottleneck for the entire organization. Every "can you tweak this measure" turns into a queue item. Tools with simpler expression languages, or with AI layers that abstract over them, sidestep this problem.
Embedded analytics is friction-heavy. Power BI Embedded uses shared capacity at lower tiers, which creates burst-concurrency throttling when SaaS products serve dozens or hundreds of tenants simultaneously. Multi-tenant isolation, row-level security at scale, and white-labeling all require careful Fabric capacity sizing and meaningful engineering investment.
Non-Microsoft stacks face daily friction. Power BI Desktop is Windows-only. Teams on macOS, Linux, AWS, or GCP feel it constantly. Tooling-level friction compounds.
None of these are universal. Microsoft-centric teams with bounded user counts and modest data volumes run Power BI for years without hitting any of them. Once a deployment crosses certain thresholds (multi-cloud, multi-tenant, 500-plus concurrent users), the architecture starts to strain. That threshold is what drives most evaluations.
One pattern worth flagging before we get to the alternatives. The teams that successfully migrate from Power BI share two characteristics. They are clear about which specific architectural problem they are solving, and they accept that they will lose some Power BI strengths in exchange for solving it. The teams that struggle usually do neither. They describe the problem as "Power BI is not working" rather than naming a specific architectural breakpoint, and they expect the alternative to solve every problem at once. The migration tax is real and the labor market for Power BI is the largest in BI, which means picking the wrong target tool creates a second migration two years later.
Power BI alternatives at a glance
All prices verified against vendor pricing pages or independent procurement data on May 13, 2026.
The four archetypes that determine your shortlist
Most "Power BI alternatives" articles list tools as if they are interchangeable. They are not. The reason a team is leaving Power BI tells you which alternatives belong on the shortlist and which do not.
The Visualization Refugee wants polished visual storytelling and the analyst-led culture Tableau pioneered. They are not fighting governance. They want better charts and a more flexible canvas. Tableau is the textbook answer, Qlik Sense the credible alternative.
The Governance Seeker is leaving because metrics do not reconcile across dashboards. Revenue means three different things to three different teams, and the executive team trusts none of them. Looker, with LookML and Git-based version control, is the strongest answer. Domo's semantic layer is the credible alternative if all-in-one consolidation is also on the table.
The Embedded Builder is shipping analytics inside a customer-facing product and getting hammered by Power BI Embedded's capacity math. They need multi-tenant isolation, white-labeling, and pricing that does not make every customer expensive. Sisense, Domo, and Looker Embed are the realistic options. ThoughtSpot Embedded is the AI-first option in this category.
The AI-Native Buyer does not want a better dashboard. They want to ask questions and get answers, grounded in governed data, without learning DAX or waiting on an analyst. ThoughtSpot built this category. Fusedash, Domo, and Looker's Conversational Analytics are competing for it in 2026. The growth of this archetype is the biggest change in BI buying versus 2024.
A fifth, smaller archetype, the Cost-Constrained Pragmatist, exists for teams whose Fabric capacity math broke and who cannot justify enterprise spend. Metabase is the credible escape hatch.
Teams that fit cleanly into one archetype get to a decision faster. Teams that fit two often need to split tools: internal analytics with one platform, customer-facing analytics with another.
The 8 alternatives
1. Tableau
Verdict first. If your problem is visualization quality, this is the answer. If your problem is anything else, it is not.
Tableau still owns the visualization category. The drag-and-drop canvas, the chart-type depth, the analyst hiring pool. Nothing else on this list matches it for pure visual flexibility, and the 2025 to 2026 investment in Tableau Agent (the agentic AI layer in the Tableau+ bundle, now generally available) added conversational analytics that compete head-to-head with ThoughtSpot Spotter.
Pricing on Tableau Cloud Standard, verified May 2026: Viewer $15, Explorer $42, Creator $75 per user per month, billed annually. Enterprise runs $35, $70, $115 and adds Advanced Management, Data Management, and full eLearning. The Tableau+ Bundle (Tableau Agent, Pulse premium features) is contact-sales.
The cost reality. A 500-user deployment with the typical license mix runs $200,000 to $400,000 annually. Governance features Power BI bundles into PPU cost extra in Tableau. Tableau Cloud's embedded analytics pricing, independently reported at roughly $35 per viewer per month, breaks the math for SaaS products with thousands of end users.
Choose Tableau when visualization is the actual problem. Choose something else if you think prettier dashboards will solve a governance problem, because they will not.
2. Looker
Looker is the answer to a specific problem most BI tools cannot solve: revenue means different things in different dashboards, and the executive team has stopped trusting any of them. LookML, the YAML-like modeling language, forces metrics to be defined once and reused everywhere. Git-based version control makes the model audit-ready, with pull requests and rollback the same way developers manage code.
Conversational Analytics in Looker, powered by Gemini and generally available in 2026 (free usage through September 30, 2026), is structurally different from Power BI Copilot. The AI agent grounds answers in the LookML semantic layer, the same model the dashboards use. This avoids the "AI invented a metric" problem that haunts text-to-SQL approaches. For governed AI in business intelligence dashboards, this is currently the strongest implementation on the market.
Google does not publish Looker prices. Independent buyer reports place the platform floor at $35,000 to $66,000 per year for Standard, around $132,000 per year for Enterprise, and $180,000 to $198,000 per year for Embed. User licenses (Developer, Standard, Viewer) are quoted separately. Each edition includes 10 Standard Users and 2 Developer Users in the base. Embedded deployments use per-viewer pricing reportedly around $400 per viewer per year in mid-market deals.
Where Looker loses to Power BI: cost, LookML developer dependency (you are hiring engineers, not analysts), implementation timelines measured in months, and visualization that is competent but does not match Tableau or Power BI for design polish. The tight Google Cloud coupling matters more than it should for teams on AWS or Azure, and Google has been notably quiet about Looker's standalone roadmap in the post-acquisition period.
If semantic governance is the actual problem and you have engineering capacity to maintain LookML, Looker remains the strongest answer. If you do not have that capacity, the model decays.
3. Sisense
The headline for Sisense in 2026 is that the company has narrowed its focus. After Perforce Software acquired it in May 2024 (Sisense now operates as a business unit under GM Ariel Katz), product attention has concentrated on embedded analytics rather than general-purpose BI. The in-chip processing architecture handles large datasets faster than query-on-read approaches. Multi-tenant isolation, row-level security at the data layer, and white-labeling are built in. The GenAI-powered analytics suite launched in 2025 added natural-language querying.
Pricing is custom. Independent procurement data shows deal sizes from $50,000 to $300,000-plus depending on user count and embedded usage.
For ISVs hitting the wall on Power BI Embedded's capacity model, Sisense is the most direct alternative. The multi-tenant architecture is mature, the SDK is well-documented, and the in-chip engine handles tens of millions of rows interactively. For internal-only BI, the case is weaker. The connector library skews toward relational and cloud warehouse sources rather than NoSQL. Implementation is heavier than Power BI Desktop. Pricing opacity makes budgeting harder than published-list alternatives.
This is a tool with a clear use case. Pick it when that use case is yours.
4. Qlik Sense
Qlik does one thing no other BI tool on this list does. The associative data engine maintains every relationship between data points in memory and lets you explore non-linearly. Click a value in one field. See instantly what is associated and what is excluded across every other field. For exploratory analysis on complex datasets, this is genuinely different from query-based BI, and analysts who have used it have a hard time going back.
Qlik moved fully to capacity-based pricing in March 2025. Standard runs around $825 per month for 20 full users with capacity scaling. Premium is around $2,700 per month for 20 full users plus 10,000 basic-user seats. Enterprise is custom. Qlik AutoML and Insight Advisor, the AI-augmented analytics suite, bundle into higher tiers.
The associative engine wins for retail, manufacturing, and financial services use cases where the analytical questions are not known in advance. In-memory processing handles larger datasets than Power BI Pro's 1 GB limit, by a substantial margin.
The case against. The associative model is a mental shift, not a substitute control panel for query-based BI. Visualization design lags Tableau. The community is a fraction of Power BI's, which makes hiring harder. Migration from the older QlikView product to Qlik Sense remains painful for teams that have not done it.
Right tool if exploration drives the analytical work. Wrong tool if the work is dashboarding for executives.
5. ThoughtSpot
ThoughtSpot built the category that everyone else is now copying. Spotter 3 (the 2026 iteration of their AI analyst) translates natural-language questions into search tokens grounded in a governed semantic layer. The semantic grounding is the important part. Spotter does not hallucinate metrics or join the wrong tables the way text-to-SQL approaches sometimes do, because the semantic layer constrains what it can ask. Users type "which products had the highest margin last quarter" and get a chart with drill-down, governed and auditable.
Essentials is $25 per user per month (5 to 50 users, 25 million rows). Pro is $50 per user per month (25 to 1,000 users, 250 million rows, Spotter AI with 25 queries per user per month). Enterprise is custom and unlimited. ThoughtSpot Embedded has separate pricing.
There is a tension with ThoughtSpot between what marketing promises and what setup requires. Marketing promises that business users can self-serve with natural language. Setup requires meaningful data modeling investment before Spotter is useful, which means analysts and engineers before the business users see value. Once that work is done, the search-first UX shortens time-to-answer dramatically. Before that work is done, ThoughtSpot is no faster than Power BI.
The dashboard side is the weak spot. Tableau and Power BI both produce better publication-ready visuals. Power BI Pro at $14 per user per month is dramatically cheaper than ThoughtSpot Pro at $50, so the comparison is not purely about features.
For organizations where business users asking ad-hoc questions is the primary use case, and where data engineering capacity exists to model for search, ThoughtSpot is the most mature option in this category.
6. Domo
Domo's pitch is consolidation. Data integration, ETL via Magic ETL, semantic modeling, dashboards, AI, mobile distribution, and increasingly agentic AI via Agent Catalyst and the AI Agent Store, all in one platform with one bill. The argument is that one platform beats four separate tools held together with integration glue. For some buyers this is exactly right. For others it pays full retail for capabilities they already have.
Domo moved to consumption-based credit pricing in 2023, so there is no published per-user list. Independent procurement data places the floor at around $30,000 per year for small teams (10 to 25 users), $100,000 to $150,000 per year for mid-market (50 to 100 users), and $300,000-plus per year for enterprise (200-plus users). The median Vendr buyer pays roughly $60,500 per year. Credits get consumed by data ingestion, ETL runs, dashboard refreshes, and AI features.
There is a pattern in Domo buyer feedback worth flagging. Renewal increases of 50 percent or more come up repeatedly in published reviews on TrustRadius, G2, and procurement forums. The consumption model creates a budget surface that expands with use, and renewal negotiations tend to lock in that expansion. Anyone evaluating Domo should model three-year cost, not first-year cost.
The platform strengths are real. Mobile experience is the best in BI because Domo built mobile-first. The agentic AI roadmap is credible. For organizations consolidating from Tableau plus Fivetran plus a custom ETL stack plus an AI tool, the bundled value can cover the price.
Pick Domo when the consolidation math actually works in your favor. Test the math before signing, because the comparison is sometimes flattering only in slides.
7. Metabase
There is a specific moment where Metabase becomes obvious. The moment is when your Power BI deployment crosses the user threshold where Fabric capacity becomes the only economic option, and the capacity bill arrives, and the math no longer works.
Metabase is the only tool on this list with a meaningful free path. The open-source edition (AGPL v3) is production-capable for internal analytics. Cloud Starter at $100 per month and Pro at $575 per month make Metabase the obvious answer when Fabric capacity math breaks. Metabot AI, a new 2026 add-on at $100 per month for 500 queries, brings natural-language querying to the platform. The Data Studio semantic-layer workbench shipped in v59.
Verified pricing, May 2026: Open-source free, self-hosted. Cloud Starter $100 per month base plus $6 per user per month (5 users included). Cloud Pro $575 per month base plus $12 per user per month (10 users included). Enterprise starts around $20,000 per year. Annual billing saves 10 percent across tiers.
The limits. Governance features (row-level security at scale, audit logs, white-labeling) are gated to Pro tier and above. The semantic layer is newer than what Looker offers and the patterns are still settling. There is no native NoSQL support, which means MongoDB or Elasticsearch teams need an ETL layer between the data and Metabase. Embedded analytics is basic and not multi-tenant ready out of the box.
For budget-constrained internal analytics, this is the answer. For enterprise replacement of Power BI at scale, the governance gap matters more than the cost savings.
8. Fusedash
Fusedash is the newest entrant on this list. It is built on a specific bet: that the dashboard-first model is being replaced by an AI-native workflow where users move between chat, chart generation, dashboards, maps, and storytelling reports in one workspace. The product approach inverts Power BI's. Instead of learning DAX to build a measure, users describe what they want and the AI generates the chart, the report, or the storytelling sequence. A user who would have spent 90 minutes in Power BI Desktop building a "Q1 vs Q2 revenue by region with callouts for the biggest movers" view writes that sentence in Fusedash and gets the chart, the narrative, and the drill-down without writing a DAX measure.
Pricing is usage-based via token packs. Top up anytime. There is no per-seat tax as audiences grow. A free tier is available for initial exploration.
What Fusedash bets on is real. Time-to-first-chart is measured in minutes, not the days a typical Power BI deployment requires. Usage-based pricing avoids the "every viewer is another paid license" math that breaks Power BI deployments at scale. Chat-with-data and AI-built storytelling reports combine narrative and visuals in ways that traditional dashboard tools cannot.
What Fusedash has not yet built out is what every newer entrant has not yet built out. The analyst community is smaller. Enterprise governance features (mature RLS, full audit trails, SCIM provisioning) are still maturing. Token-based pricing requires forecasting usage rather than budgeting seats, which is a different planning exercise. There is no on-premises deployment. For organizations that need an air-gapped install or a five-year procurement cycle, Fusedash is too early.
For teams where the AI-native workflow is the actual reason for leaving Power BI, Fusedash is worth evaluating against ThoughtSpot. For executive reports that need pixel-perfect visualization design, Tableau remains the answer.
Migrating from Power BI
Most articles in this category skip the migration section. It is the section that matters most once you are past the comparison stage.
Migrations vary in difficulty by a factor of ten. A small team with a handful of dashboards on a single semantic model finishes in 4 to 6 weeks. A mid-market deployment with 50 to 100 reports, custom DAX measures, and multiple workspaces takes 3 to 4 months. Enterprise migrations with 500-plus reports, complex RLS rules, paginated reports, and deployment pipelines run 6 to 12 months in practice. The teams that get this wrong invariably underestimate calculation rework.
Five workstreams determine the timeline.
Calculation translation is the hardest. Every DAX measure has to be rewritten in the target platform's syntax, and the rewrite has to produce mathematically identical results. A simple year-over-year measure in each platform:
-- Power BI DAX
Total Sales YoY =
CALCULATE([Total Sales], SAMEPERIODLASTYEAR('Date'[Date]))

-- Tableau (Level of Detail expression)
{ FIXED [Year]-1 : SUM([Sales]) }

-- Looker (LookML)
measure: total_sales_yoy {
  type: number
  sql: SUM(CASE WHEN year = (EXTRACT(YEAR FROM CURRENT_DATE) - 1)
       THEN ${sales} END) ;;
}

-- Metabase (SQL question or model)
SELECT SUM(sales) FROM orders
WHERE EXTRACT(YEAR FROM order_date) = EXTRACT(YEAR FROM CURRENT_DATE) - 1;
Time-intelligence functions (TOTALYTD, DATEADD, PARALLELPERIOD) are particularly painful because every platform handles date logic differently. Budget time for testing every translated measure against the Power BI baseline before retiring the original.
Semantic-model translation is the second workstream. The Power BI Tabular model maps cleanly enough to LookML, Domo's semantic layer, or Sisense's elasticubes, but the mapping is rarely 1:1. Relationships, calculated columns, and inactive relationships all need attention.
Row-level security mapping is the third workstream and tends to surprise teams. Power BI uses RLS roles with DAX filters. Tableau uses data source filters or entitlement tables. Looker uses access_filter and access_grant in LookML. Each model encodes the same intent differently, and bugs in this layer expose data to the wrong people.
Refresh schedule and gateway migration is the fourth workstream. Power BI Pro caps scheduled refreshes at 8 per day, PPU and Premium at 48 per day. Warehouse-native tools like Looker remove the refresh model entirely, but require warehouse query patterns to be optimized for the new shape.
Distribution and embed migration is the fifth. Power BI Apps do not map cleanly to other tools' distribution models. Customer-facing embedded reports usually require full re-implementation rather than a port.
The single most common mistake is underestimating calculation rework. Teams budget for the new tool's licenses and miss that translating 200 DAX measures is 200 small projects, each with its own validation cycle. Running both platforms in parallel for 60 to 90 days is non-negotiable for any migration above small-team scale.
How to make the final call
Three questions decide the outcome after the shortlist. Teams that get them wrong end up migrating twice.
What is the actual problem? Most teams describe the problem as "Power BI is not working" when the underlying issue is one of four things. Visualization-driven migrations should look at Tableau. Governance-driven migrations should look at Looker. Embedded migrations should look at Sisense, Domo, or Looker Embed. AI-workflow migrations should look at ThoughtSpot or Fusedash. Picking the wrong category means migrating and hitting the same wall in a different tool.
What is the real three-year budget? Most BI deployments are 1.5x to 2.5x more expensive in year three than in year one, because user counts grow, paginated reports get added, and AI features unlock. The number on a vendor's pricing page does not tell you what you will pay in 2028.
Who owns the platform after migration? Looker requires LookML developers. Tableau requires analysts with Tableau skill. Domo requires admins comfortable with the credit model. Power BI's biggest advantage on this dimension is the largest pool of trained analysts in BI, a moat that does not show up in feature comparisons but determines what your team can hire for in 2027. Whatever you pick, plan for ownership.
Then run a 30-day proof of concept on the top two alternatives with real data and real questions. Vendor demos always work. The only thing that matters is whether the tool works on your data, your way.