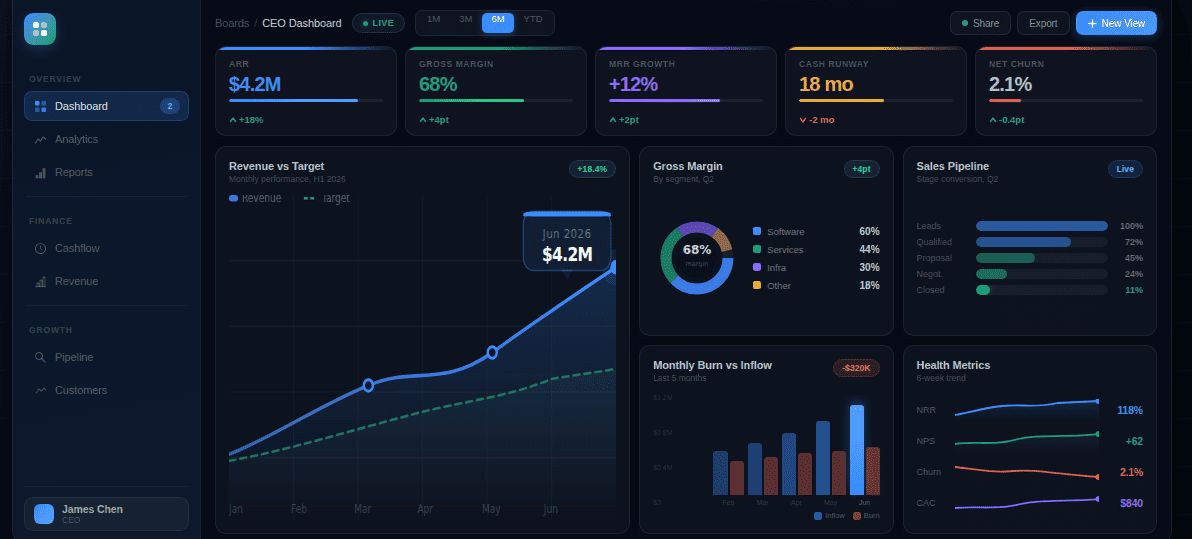
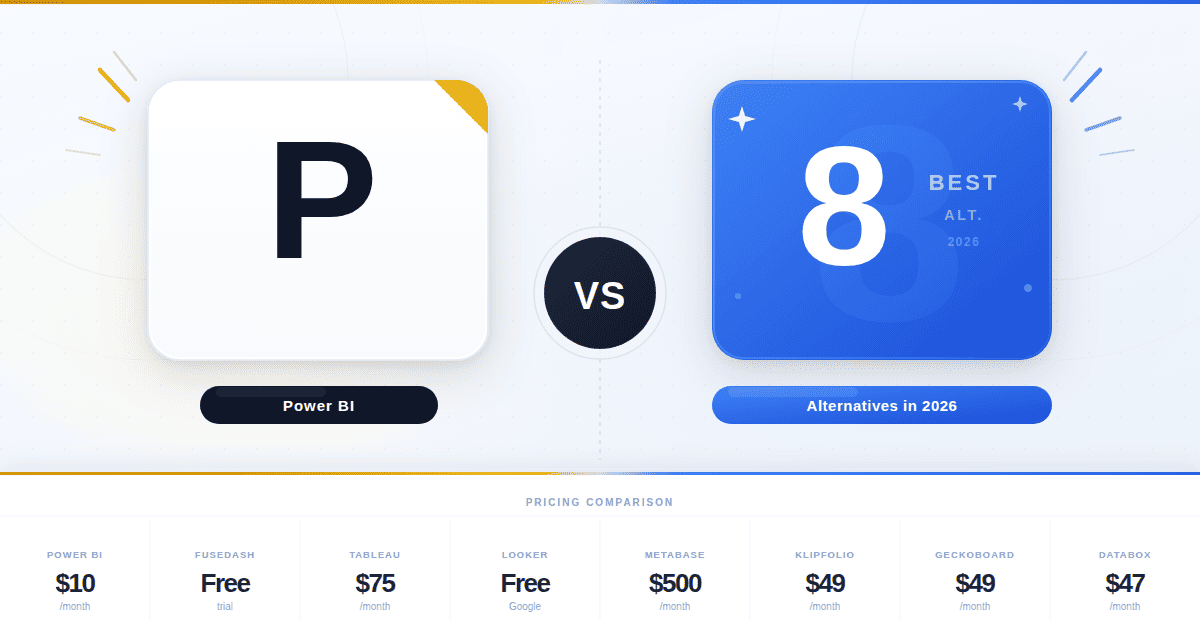
AI Dashboard Tips, KPI Guides & Data Insights

Whether you're building your first KPI dashboard or refining how your team reports on metrics, this is where you'll find practical, no-fluff guidance. We cover AI-powered dashboards, data visualization best practices, SaaS and ecommerce KPIs, real-time monitoring and executive reporting for analysts, business leaders, and teams who want to turn data into faster decisions.

Thank you! Your submission has been received!
Oops! Something went wrong while submitting the form.
Tableau Alternatives
March 23, 2026
Tableau Alternatives: 8 Tools Worth Switching To in 2026
The 8 best Tableau alternatives in 2026, ranked honestly. Power BI, Fusedash, Looker Studio, ThoughtSpot, Metabase and more — with pricing, limitations, and who each one is actually for.
Read More
Data storytelling framework showing the 5-part story, insight statement formula, and 1-page template
March 12, 2026
Data Storytelling Framework
A practical data storytelling framework that turns charts into decisions. Use the 5-part story, insight statement formula, annotation tactics, and a 1-page template to explain what changed, why it happened, and what action to take next.
Read More
Dashboard vs report vs presentation comparison framework for choosing the right format
March 10, 2026
Dashboard vs Report vs Presentation
Dashboards monitor KPIs in real time, reports explain what happened and why, and presentations turn insights into decisions. Learn the differences, when to use each format, and a simple audience-cadence-depth framework to choose the right one.
Read More
Track the ecommerce dashboard KPIs that actually drive revenue:
March 6, 2026
Ecommerce Dashboard KPIs: Conversion, AOV, ROAS, Inventory
Track the ecommerce dashboard KPIs that actually drive revenue: conversion, AOV, ROAS, inventory, and fulfillment. Use a KPI tree to diagnose drops fast and run a weekly review to prioritize the next fix.
Read More
Definition AI dashboards
March 3, 2026
What Is an AI Dashboard? Definition, How It Works, and Why It Matters
An AI dashboard automatically generates charts, detects anomalies, and answers questions about your data in plain language. Here is how it works and why it matters.
Read More
Big data analytics dashboard showing KPIs and real-time metrics
March 2, 2026
How to Choose Big Data Analytics Tools
Choosing the wrong analytics tool wastes budget and kills adoption. This guide gives you a practical framework, scorecard, pilot checklist, and requirement templates to pick the right big data analytics stack for your team.
Read More
Dashboard software interface with KPI cards, charts, filters, and a summary table
February 25, 2026
Dashboard Software Explained: Definition, Use Cases, Buying Checklist
Dashboard software brings your key metrics into one place so teams can monitor performance, spot changes, and act fast. Learn what dashboard software is, when to use dashboards vs reports, and what to look for before choosing a platform.
Read More
SaaS dashboard showing MRR waterfall, NRR trend, churn KPIs, and cohort retention chart
February 23, 2026
SaaS Dashboard KPIs: MRR, Churn, Retention, and Expansion
A practical guide to SaaS dashboard KPIs, including MRR components, NRR, churn and cohorts, activation and time-to-value, and expansion signals. Includes dashboard layout blueprints and a weekly review template.
Read More
Real-time KPI dashboard with live metrics, alerts, and trend charts
February 18, 2026
Real-Time KPI Dashboard Guide: What to Track Live and What Not To
A real-time KPI dashboard only works if you track the right leading indicators. This guide breaks down what to monitor live by team, how to set thresholds and baseline alerts, and which metrics to keep out of real-time views.
Read More